


During the playoffs last year, we started a new tracking project. By keeping track of when the puck enters the offensive zone, who brings it in, and how they bring it in, we’ve been able to pull out a lot of information about system and results.
The team that wins the neutral zone will likely have more entries than their opponent, while getting more shots from each entry is a sign of winning the attack zone play. Individual contributions are tracked, as are the frequency of carrying the puck in versus playing dump and chase. If you’re interested in reading more about how this came about or what we’ve seen so far, check the zone entry archives.
In this post, we look at the data from the Flyers‘ first four games. What is the team doing well? Who’s driving the play? Find out after the jump.
A change from last year: excluding blocked shots
There’s one change from last year already: we’ve switched from tracking total shot attempts per entry (including blocked shots, like the Corsi statistic) to tracking only shots that go through towards the net (like the Fenwick statistic, still including missed shots). To explain that change, let’s start by looking at why blocked shots are included in Corsi in the first place.
Corsi and Fenwick both correlate strongly with goal scoring; Corsi correlates better over small sample sizes (under something like 3000 minutes of play) and Fenwick does better over large samples. Corsi does better over small samples because including blocked shots increases the sample size and give us more confidence that the small data set is giving us a good measure of puck possession and zone time. But Fenwick does better over large samples because the possessions that result in blocked shots aren’t as dangerous as the ones where a shot gets through.
For this study, the zone entries themselves will be a measure of puck possession and zone time; we want the shot counting to measure how dangerous the entry was. That measure should be more effective if we include only shots that get through.
OK, enough of the theory interlude; let’s get to the data.
Team totals
Recording what percentage of zone entries a team gets at 5 on 5 play gives us a measure of who controlled the puck more in the neutral zone and brought it forwards.

The Flyers dominated the neutral zone against New Jersey in game 2, consistently pushing the puck from the neutral zone into the offensive zone. They had a slight edge against Boston and Los Angeles, and lost the neutral zone against Vancouver in game 3. Overall for the year, they are getting 51.3% of the zone entries — the sample size is not large enough for statistical confidence that this will persist (p = .27), but the team is off to a good start.
We also calculate how many shots developed from each entry, which gives us a measure of how effective each team was in the offensive zone.
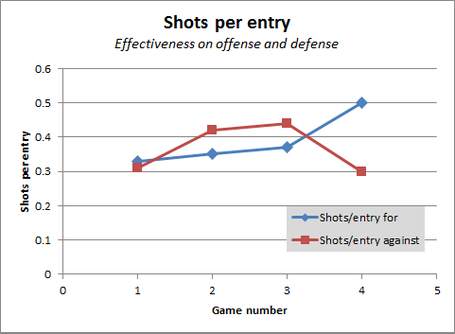
The blue curve is a measure of how effective the Flyers were in the offensive end and the red curve measures their opponents’ offensive success. For the year, the Flyers have 1.7% more shots per entry than their opponents, but that advantage is almost entirely from markedly outshooting the Kings at even strength. As the year goes on, this chart should reveal trends such as the offense improving with developing chemistry or the defense getting weaker as Pronger and TImonen wear down.
Individual play
There are a lot of statistics that can be calculated from this data, and we are still figuring out what looks most compelling.
One thing that looks particularly exciting is that zone entry total may help indicate the puck-moving defenseman. Ever since I showed that defenseman assists at even strength have virtually no year-over-year correlation, I’ve wanted to find a stat that would help distinguish these players. Both in last year’s playoffs and thus far in this year, Kimmo Timonen has led the team’s defensemen in entries per 60 by a healthy margin.
| Player | Entries/60 | Controlled entries/60 |
| Timonen | 16.5 | 7.6 |
| Lilja | 11.4 | 0.0 |
| Coburn | 10.6 | 1.9 |
| Carle | 5.1 | 2.0 |
| Meszaros | 3.8 | 1.3 |
| Pronger | 2.5 | 1.3 |
Timonen clearly brings the puck through the neutral zone more than any other defenseman on the team, and more frequently does it with control (i.e. by carrying or passing the puck across the blue line).
For forwards, the stat picture is still evolving but the stat that looked most individual-centered in last year’s playoffs was shots from the player’s controlled entries. Percent of entries with control shows who is bringing the puck into the zone with control, but there is a marked difference between Jakub Voracek (85% of entries with control, producing 0.91 shots per controlled entry) and Zac Rinaldo (86% of entries with control, producing 0.17 shots per controlled entry). Voracek brings the puck into the zone and sets up an effective play; Rinaldo brings the puck into the zone and loses it.
Combining these stats gives us a metric that looks to be useful: shots per 60 arising from the player’s controlled entries gives a measure of how often the player sets up an effective play.
| Player | Entries/60 | Entries with control | Shots per controlled entry | Shots/60 from controlled entries |
| Briere | 35.1 | 75% | .57 | 15.0 |
| Voracek | 18.4 | 85% | .91 | 14.2 |
| Nodl | 26.1 | 67% | .75 | 13.1 |
| Read | 35.0 | 59% | .54 | 11.1 |
| Hartnell | 22.9 | 56% | .67 | 8.6 |
| Giroux | 26.4 | 53% | .60 | 8.3 |
| Couturier | 24.9 | 44% | .57 | 6.2 |
| Jagr | 23.7 | 69% | .36 | 5.9 |
| van Riemsdyk | 21.0 | 69% | .36 | 5.2 |
| Talbot | 12.3 | 57% | .50 | 3.5 |
| Rinaldo | 19.7 | 86% | .17 | 2.8 |
| Simmonds | 28.6 | 67% | .14 | 2.7 |
I’m hesitant to get into these numbers in too much detail because each player just doesn’t have that much ice time yet, but there are some things we can watch going forwards. Is Couturier’s low controlled-entry percentage a sign of timidness at the blue line? Can Voracek continue to set up the play to create so many shots, and will those shots start turning into goals for his line? Why are the numbers for the Giroux line low across the board — I’m not fretting about it yet, but it’s not the wizardry we were hoping to get from them.
Finally, I’d like to conclude by pointing out an important piece of the puzzle that’s still missing: it would be really nice to merge our data with shift charts so that we can work out who was on the ice for each zone entry. This would allow us to develop a plus-minus for zone entry total — the players who are on the ice for a lot of zone entries for and few zone entries against are likely to be drivers of possession. It would also give a window into offensive effectiveness beyond the puck control highlighted above (who helps their team generate a lot of shots per entry when they are on the ice?) and defensive effectiveness not yet recorded (who helps their team get the puck out of the zone without a shot against when they are on the ice?)
Zone entries give us a really nice window into puck possession in the neutral zone and effectiveness in the attack zones. We are still just scraping the surface of what we can read into it.


