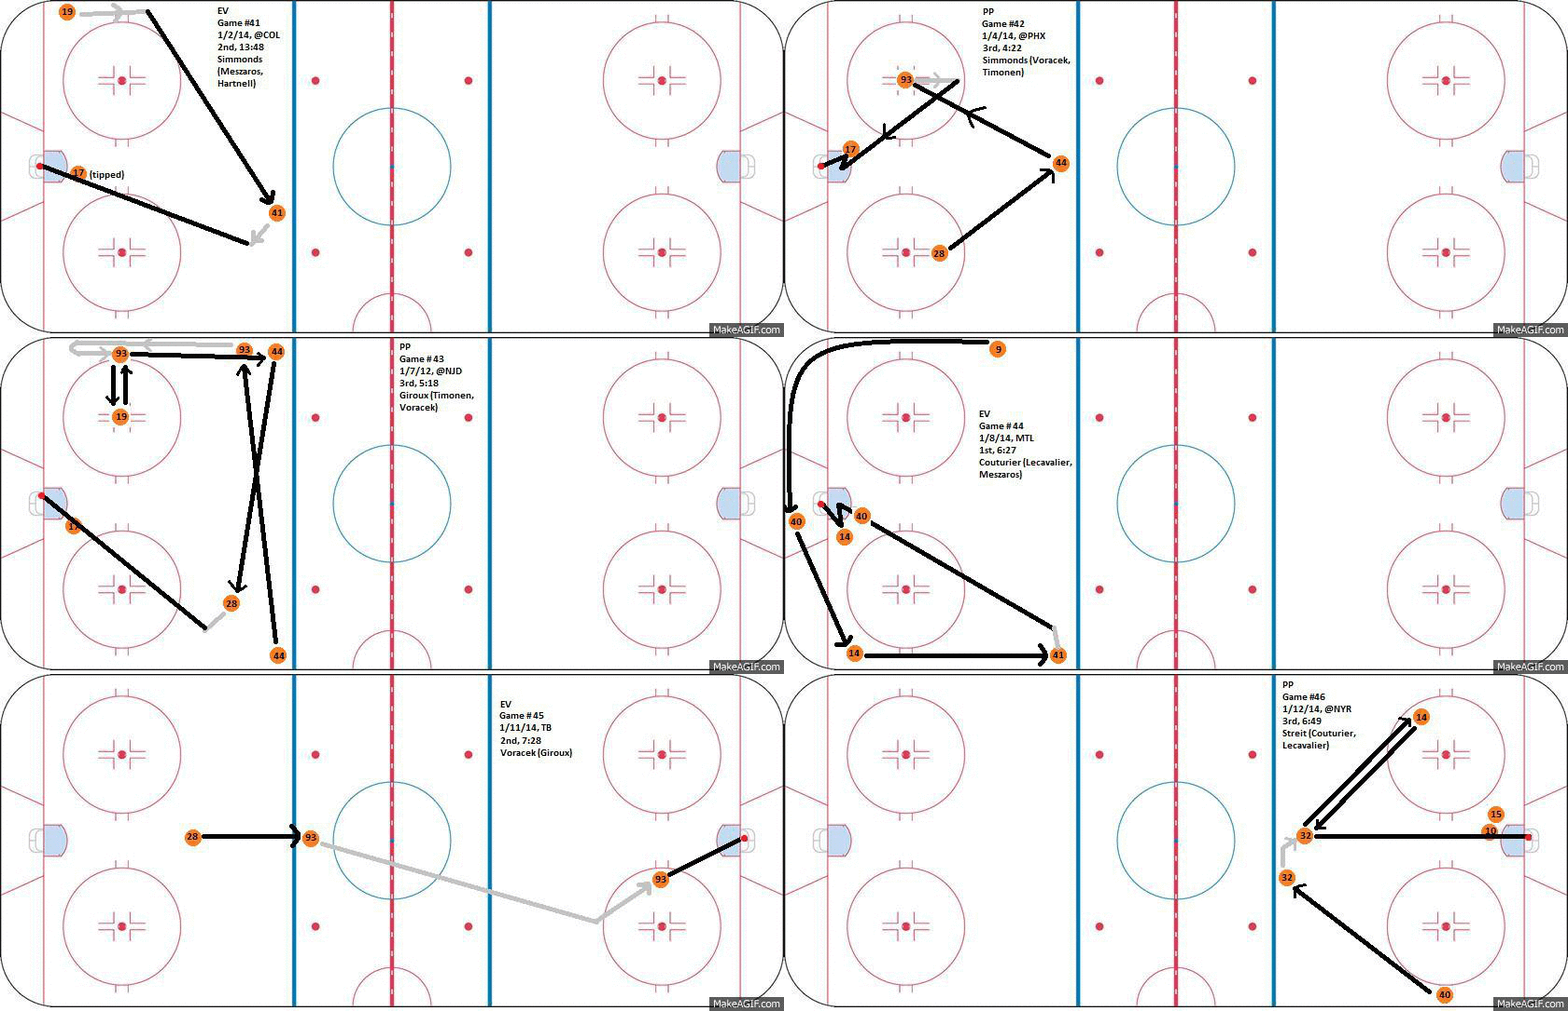
So I got bored this weekend and was trying to think of something cool to put on the site this week. I decided it had been a while since I put my mad MS Paint skills to good use (especially since the diagram in last week’s post about Claude Giroux seemed to go over so well), I thought I’d try something fun here and draw up what’s happened on every Flyers goal so far in the month of January, whiteboard-style.
The end result is the .GIF below. Enjoy!
KEY:
- Gray line = player moving with puck
Black line = movement of puck via pass/shot/rebound/etc. - Red dot in net = goal
- Orange dot = Flyers player (number = number of player)
- Arrow = direction the player/puck is traveling/
Not a whole bunch of trends to draw out of just those 16 goals, but still kinda fun to look at regardless. If you’d like to see each individual picture by itself, see the below gallery.


