


Following on from my article on the even-strength scoring chance season summary for individuals and Geoff’s articles of player results on the power play and penalty kill, this post will review the entire team results.
| Total CF | Total CA | Total C% | ES CF | ES CA | ES C% | |
| 1 | 415 | 375 | 52.5% | 268 | 273 | 49.5% |
| 2 | 478 | 405 | 54.1% | 332 | 310 | 51.7% |
| 3 | 416 | 359 | 53.7% | 325 | 299 | 52.1% |
| 4 | 32 | 18 | 64.0% | 24 | 13 | 64.9% |
| Totals | 1341 | 1157 | 53.7% | 949 | 895 | 51.5% |
| Totals-OT | 1309 | 1139 | 53.5% | 925 | 882 | 51.2% |
CF, chances for; CA, chances against; C%, Flyers percentage of chances
For a comparison, here are the links to the chance summaries for Games 1-11, Games 12-22 and Games 1-41. At the mid-point of the season the Flyers had a 54.7 total chance percentage and a 51.8 even-strength chance percentage (removing OT). This was a considerable decrease from the first 22 games when the Flyers were getting 56.8% of total chances and 54.9% of even-strength chances (the difference between an average and elite Fenwick team can be 3%) but was more reflective of the teams true talent. It is hard to say how the Flyers compare to other teams that had chances recorded as not all recorders posted a team chance summary but the even strength % of 51.2 is similar to the Flyers Fenwick Close score of 51.14%, ranking them 9th overall. It makes intuitive sense that scoring chances won’t be affected greatly by score-effects (the outcome where trailing teams outshoot their opponents) as a shot from the scoring chance zone requires some effort to get. In any case, overall the Flyers outchanced their opponents.
Plotting chances on a game by game basis produced a graph that was impossible to read anything from due to occasional large fluctuations in chance percentages between games. In order to smooth the graph out to make general trends more obvious I looked at 5 and 10 game moving averages (which is why the graphs end before 82 games).
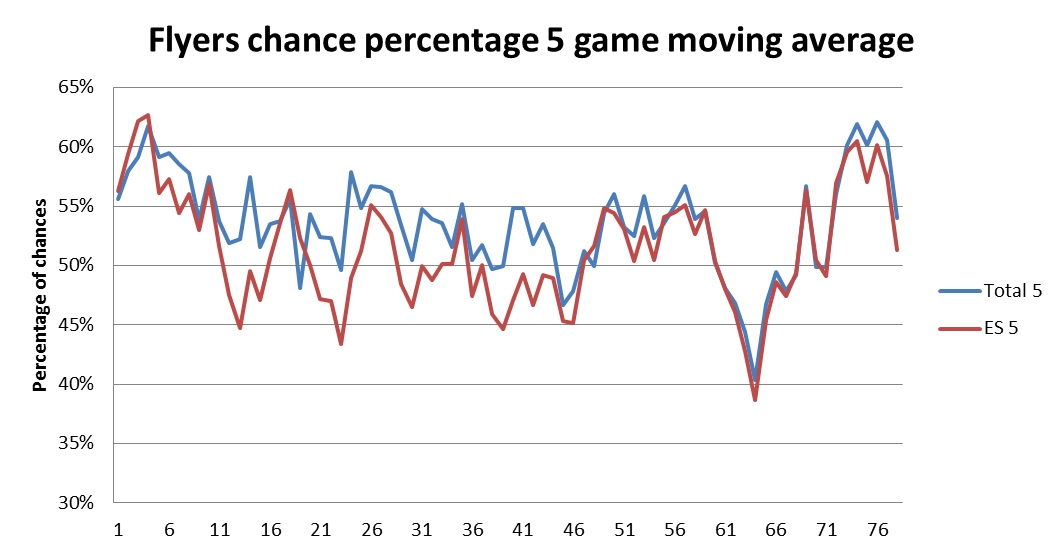
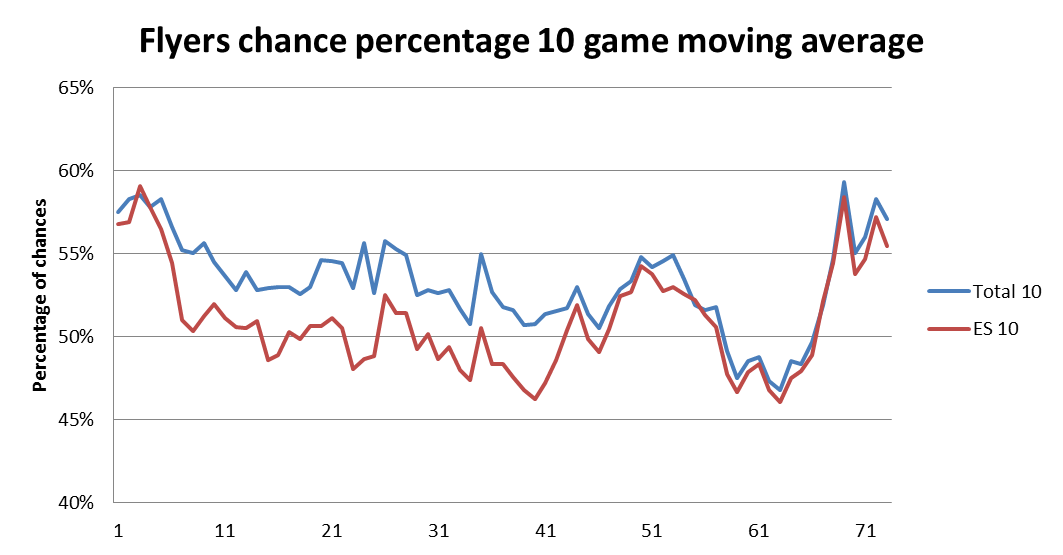
The graphs are still a little messy, but some general trends can be drawn from them
- For most of the season the Flyers were above 50% for total chances
- Their even-strength chance percentage was much more variable, going above and below 50%.
- Between approximately games 36-46 there was a dip in even-strength chance percentage, but the total chance percentage remained above 50%. In those games, the Flyers had an 8-3 record.
- The even-strength chance percentage dipped again between games 58-68, but this time the total chance percentage dropped below 50% too. Their record then was 7-4, with one OT victory and two in shootout (!). Games 67 and 68 were particularly bad. Against Toronto (67) they were outchanced 9-17 and against New Jersey (68) they were outchanced 7-18.
Special teams
| PP CF | PP CA | SH CF | SH CA | |
| 1 | 128 | 15 | 19 | 87 |
| 2 | 119 | 13 | 27 | 82 |
| 3 | 74 | 8 | 17 | 52 |
| 4 | 8 | 0 | 0 | 5 |
| Totals | 329 | 36 | 63 | 226 |
| Totals-OT | 321 | 36 | 63 | 221 |
The Flyers went on the powerplay the most of all teams this season, 335 times, and it provided 66 goals. They generated just under once chance every powerplay and one chance for roughly 40 seconds of powerplay time.
They were also shorthanded the most of all teams this season, going on the penalty kill 319 times. The penalty kill allowed 0.7 chances per kill and 0.88 chances per minute of PK time. Moreover, they got twice as many chances on their penalty kills as their opponents managed.
Summary
The Flyers were an average team at even-strength but had very good special teams. This was something I suspected throughout most of last season, but I’d be interested to hear if other people had a differing opinion.
Eric has shown that there is a strong correlation between scoring chances and shot totals (Fenwick) and now many involved with scoring chance tracking are wondering what value there is in recording this data manually when we can get similarly useful data pulling data from NHL.com.
Scoring chances may be more intuitively important to winning hockey games than shots, which may sit easier with those who question the conclusions drawn by the fancystatters.
So I ask this question: Are you more likely to believe conclusions made about a teams or players ability using scoring chances than shots?


