


Many regular readers of BSH know that many here put a lot of stock into the so-called “advanced statistics” — both as a way to understand what we’re watching on the ice night in and night out, and as a way to predict future events.
For example, Fenwick tied — a measure of unblocked shots directed at the net while the team is tied — is known to be an excellent way of estimating future winning percentage. This has been shown several times over the last few years, like the Devils getting more points than the Dallas Stars over the last half of the season, and the Minnesota Wild being awful this year despite spending quite some time at the top of the Western Conference.
Peter Laviolette may be unaware of the statistical powers of Fenwick numbers, but we know that he puts a lot of stock into scoring chances — and we also know that there is a correlation between Corsi/Fenwick and scoring chances. You can decide whether or not you put any stock in Fenwick numbers, but scoring chances are simple to understand and their importance is pretty obvious.
That’s why we’ve been tracking them here at BSH over the course of the season, and it’s time to get caught up on some trends over the first half of this year.
Those who want to read more about the importance of scoring chances should read this or this.
Scoring chance definition
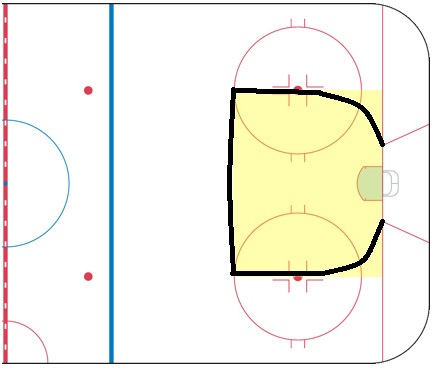
A scoring chance is defined as a clear play directed toward the opposing net from a dangerous scoring area — loosely defined as the top of the circle in and inside the faceoff dots (see below), though sometimes slightly more generous than that depending on the amount of immediately-preceding puck movement or screens in front of the net.
Blocked shots are generally not included but missed shots are. A player is awarded a scoring chance anytime he is on the ice and someone from either team has a chance to score. He is awarded a “chance for” if someone on his team has a chance to score and a “chance against” if the opposing team has a chance to score.
Scoring chance area
Simply put, I record every time an unblocked shot is taken from within the Scoring Chance Area — using a script made by Vic Ferrari — and then using that data we can see how the team and individuals are performing.
Before we get to the charts, I should note that none of this includes the Winter Classic due to script issues.
Total team chances: Games 1 through 41
| Period | Total For | Total Against | Total % | EV For | EV Against | EV % | PP CF | PP CA | SH CF | SH CA |
| 1 | 230 | 181 | 56% | 146 | 137 | 52% | 73 | 5 | 11 | 43 |
| 2 | 229 | 197 | 54% | 149 | 153 | 49% | 66 | 5 | 14 | 49 |
| 3 | 205 | 172 | 54% | 162 | 136 | 54% | 33 | 4 | 10 | 42 |
| 4 | 14 | 10 | 58% | 7 | 5 | 58% | 7 | 0 | 0 | 5 |
| Totals | 678 | 560 | 55% | 464 | 431 | 52% | 179 | 14 | 35 | 139 |
This table is shown from the Flyers perspective, so SH CF/CA indicates the totals while the opponent is on the powerplay.
- The Flyers are getting 55 percent of the total chances and 52 percent of chances at even strength. Outchancing opponents = good.
The powerplay is getting approximately one chance every opportunity. A lot of the powerplay shots are from above the top of the scoring chance area and thus are not included.
The powerplay has allowed 14 total shorthanded chances. This is probably surprisingly low for people who think having four forwards on the powerplay is leading to many shorthanded rushes. - The penalty kill is still really good. The chances against are below one per kill and they get a lot of shorthanded chances/
Individual Even-Strength Chances: among players with over 100 minutes
| ES TOI | ES CF | ES CA | Chance % | ES C/60 | ES CA/60 | SC +/- per 60 | |
| M. CARLE | 725 | 204 | 161 | 56% | 16.87 | 13.32 | 3.56 |
| C. PRONGER | 178 | 46 | 36 | 56% | 15.48 | 12.11 | 3.37 |
| W. SIMMONDS | 486 | 123 | 98 | 56% | 15.17 | 12.09 | 3.08 |
| J. JAGR | 428 | 123 | 102 | 55% | 17.26 | 14.31 | 2.95 |
| J. VAN RIEMSDYK | 431 | 110 | 91 | 55% | 15.32 | 12.67 | 2.65 |
| J. VORACEK | 484 | 148 | 127 | 54% | 18.35 | 15.75 | 2.60 |
| C. GIROUX | 526 | 152 | 131 | 54% | 17.33 | 14.93 | 2.39 |
| K. TIMONEN | 560 | 132 | 112 | 54% | 14.15 | 12.01 | 2.14 |
| S. HARTNELL | 567 | 158 | 141 | 53% | 16.71 | 14.92 | 1.80 |
| B. SCHENN | 136 | 37 | 33 | 53% | 16.28 | 14.52 | 1.76 |
| D. BRIERE | 532 | 134 | 128 | 51% | 15.12 | 14.44 | 0.68 |
| M. READ | 439 | 103 | 99 | 51% | 14.08 | 13.53 | 0.55 |
| A. MESZAROS | 664 | 165 | 159 | 51% | 14.91 | 14.37 | 0.54 |
| S. COUTURIER | 336 | 72 | 69 | 51% | 12.86 | 12.33 | 0.54 |
| M. TALBOT | 474 | 121 | 118 | 51% | 15.33 | 14.95 | 0.38 |
| M. BOURDON | 300 | 71 | 72 | 50% | 14.21 | 14.41 | -0.20 |
| B. COBURN | 707 | 170 | 176 | 49% | 14.43 | 14.94 | -0.51 |
| A. LILJA | 344 | 76 | 82 | 48% | 13.27 | 14.32 | -1.05 |
| H. ZOLNIERCZYK | 196 | 34 | 47 | 42% | 10.40 | 14.38 | -3.98 |
| Z. RINALDO | 211 | 22 | 48 | 31% | 6.26 | 13.65 | -7.39 |
ES TOI, even-strength time on ice; ES CF/CA, total even-strength chances for/against; chance%, percentage of chances for when on the ice ES C/60, number of even-strength chances per 60 minutes of ice time; SC +/- per 60, chances for-chances against per 60 minutes of ice time.
- If I had run a competition to see who the top four forwards as far as chances per 60, how many would have picked Simmonds, Jagr, JvR and Voracek? And in that order?
- Matt Carle does not deserve your criticism.
- Couturier, Talbot and Lilja have low offensive zone starts, so should probably be given a bit of leeway when looking at their chances.
- Giroux is starting in the offensive zone just 46 percent of the time. I don’t know what that number was at the start of the season but it is a potential reason for his reduction in chances for per 60 (which was 8.68 for the first 11 games).
Even Strength Chances: players with under 100 minutes
| EV TOI | EV For | EV Against | Chance % | ES C/60 | ES CA/60 | SC +/- per 60 | |
| E. WELLWOOD | 13 | 5 | 3 | 63% | 22.47 | 13.48 | 8.99 |
| E. GUSTAFSSON | 84 | 22 | 17 | 56% | 15.70 | 12.13 | 3.57 |
| A. NODL | 99 | 18 | 13 | 58% | 10.87 | 7.85 | 3.02 |
| T. SESTITO | 24 | 4 | 4 | 50% | 10.06 | 10.06 | 0.00 |
| M. WALKER | 43 | 15 | 16 | 48% | 20.81 | 22.20 | -1.39 |
| K. MARSHALL | 87 | 27 | 30 | 47% | 18.68 | 20.76 | -2.08 |
| J. SHELLEY | 64 | 10 | 20 | 33% | 9.34 | 18.68 | -9.34 |
| B. HOLMSTROM | 11 | 0 | 4 | 0% | 0.00 | 21.82 | -21.82 |
- Gustafsson was playing well before his injury, so it will be interesting to see further data on how he’s played since his return.
Nodl barely missed the cutoff, but he was good in his limited time with the Flyers. /
PP Individual Chances For (players with low TOI have been removed)
| PP TOI | PP CF | PP CF/2min | |
| W. SIMMONDS | 138 | 92 | 1.33 |
| J. JAGR | 139 | 92 | 1.32 |
| C. GIROUX | 146 | 96 | 1.31 |
| C. PRONGER | 51 | 32 | 1.27 |
| J. VORACEK | 141 | 81 | 1.15 |
| J. VAN RIEMSDYK | 104 | 58 | 1.12 |
| K. TIMONEN | 153 | 85 | 1.11 |
| M. READ | 107 | 59 | 1.11 |
| D. BRIERE | 142 | 74 | 1.04 |
| S. HARTNELL | 122 | 63 | 1.03 |
| A. MESZAROS | 61 | 30 | 0.99 |
| M. CARLE | 124 | 58 |
0.93 |
PP TOI, powerplay time on ice; PP CF, total chances for; PP CF/2min, powerplay chances for over 2 minutes
- The most surprising thing here is that Carle is the worst performer on the powerplay./
PK Individual Chances Against
| SH TOI | SH CF | SH CF/2min | SH CA | SH CA/2min | |
| A. LILJA | 17.45 | 2 | 0.23 | 4 | 0.46 |
| M. CARLE | 63.02 | 5 | 0.16 | 17 | 0.54 |
| S. COUTURIER | 100.48 | 15 | 0.30 | 32 | 0.64 |
| M. READ | 99.40 | 12 | 0.24 | 34 | 0.68 |
| J. VORACEK | 26.25 | 1 | 0.08 | 10 | 0.76 |
| A. MESZAROS | 104.90 | 14 | 0.27 | 40 | 0.76 |
| B. COBURN | 128.73 | 19 | 0.30 | 51 | 0.79 |
| M. TALBOT | 148.63 | 21 | 0.28 | 60 | 0.81 |
| C. PRONGER | 58.80 | 7 | 0.24 | 26 | 0.88 |
| C. GIROUX | 93.77 | 14 | 0.30 | 43 | 0.92 |
| K. TIMONEN | 147.25 | 21 | 0.29 | 68 | 0.92 |
SH TOI, shorthanded time on ice; SH CF, shorthanded chances for; SH CF/2min, shorthanded chances for over 2 minutes; SH CA, shorthanded chances against, SH CA/2min, shorthanded chances against over 2 minutes.
- I’ve included the chances-for while shorthanded to show how good the penalty kill is at generating chances a man down.
Initially I thought there was a quality of competition effect with Timonen, Giroux, Talbot and Coburn taking on the opponent’s top PP line and Meszaros, Read, Couturier the main second PK unit. The players Corsi Rel QoC doesn’t seem to support this theory though./
Goalies
| ES TOI | ES CF | ES CA | Chance % | PP TOI | PP CF | PP CF/2min | SH TOI | SH CA | SH CA/2min | |
| I. BRYZGALOV | 1248 | 319 | 292 | 52% | 200 | 112 | 1.12 | 182 | 68 | 0.75 |
| S. BOBROVSKY | 583 | 139 | 139 | 50% | 101 | 59 | 1.17 | 83 | 36 | 0.87 |
This was included just to show that the Flyers have been better with Bryz in net at even strength and while shorthanded. Confidence or something, right?
As always, there is plenty here that I haven’t discussed so point them out in the comments. Also, if anyone would like the complete set of data, we’ll be happy to post it, and if anybody has any ideas on how to better examine it, let us know in the comments


