With the Philadelphia Flyers blueline struggling oh-so-mightily, it can be hard to find a silver lining. However, our Charlie O’Connor found one a couple weeks ago with Braydon Coburn’s rebound season. I couldn’t help but notice some banter among the depths of the hockey social media community in which plenty of people disagreed with the assessment that Coburn has been strong. Several people pointed to the number of turnovers he has as evidence.
Turnovers are a topic that has been frequently discussed ever since the days of Matt Carle. In today’s days of “advanced statistics”, “analytics”, “fancy stats”, “performance metrics” or whatever it is you like (or hate) to call them, it’s more important than ever to question what it is you think you know. Question the statistics you frequently reference, be them of the traditional variety, or the advanced analytics. Ask yourself “what does this measure?” and “what does it not?”.
With that, I thought it might be fun to quickly take a look at a few statistics I find to be overused and overrated. (Ed. note: this post was written prior to this week; therefore, some of the specific numbers mentioned are slightly outdated.)
Plus/minus
I think we’re getting to the point where most hockey fans are starting to recognize the flaws in plus/minus, so I won’t rehash it in depth. But I did want to start with it as it is probably the classic example of an overused and overrated statistic.
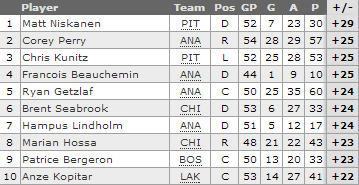
Let’s take a look at the 2013-2014 plus/minus leaders:
Now there are some good players on the list for sure, but look a little bit closer at the names on the list. The top-ten players come from a total of five teams. The top eight all come from three teams. Could it perhaps be more likely that plus/minus is more of a reflection of a team’s success than specific individuals?
I can’t help but reference the 2011-2012 plus/minus leaders, because it gives me a chuckle.
The top five players in the league were all from the same team. If this isn’t enough to make you consider that plus/minus is not the best measure (at least in a vacuum) of individual performance then I don’t know what is.
Turnovers
The statistic that inspired this article. Some fans were harping on Coburn and his 29 turnovers on the season. The fact of the matter is, if you handle the puck, you turn it over. (Which makes you wonder how poor Nicklas Grossmann has been with the puck being that he rarely handles it, and leads the team in turnovers.)
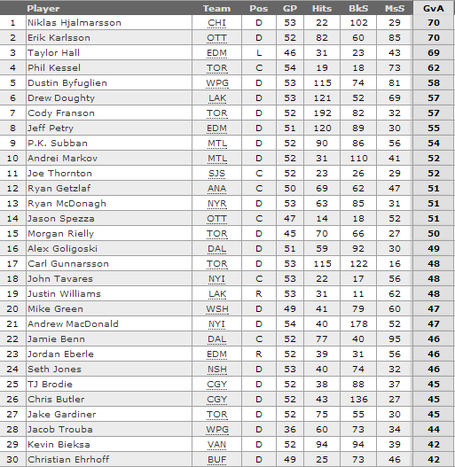
Here are the 2013-2014 leaders in turnovers:
Coburn isn’t even in the conversation of the top 30 with his 29 turnovers. More importantly, look at the names on the list. I think most any fan would gladly take any of the top six players. I’d bet you could make that claim for almost everyone on the list.
Turnovers, in and of themselves, are overrated and overused as a statistic. Think about what it’s measuring and what it isn’t. I’ll say it again, if you handle the puck, you turn it over.
Blocked Shots and Hits
I’m lumping these two together because I think they are quite similar. In fact, my argument against them is essentially the same. Before I make that argument, let’s take a gander at the league leaders.
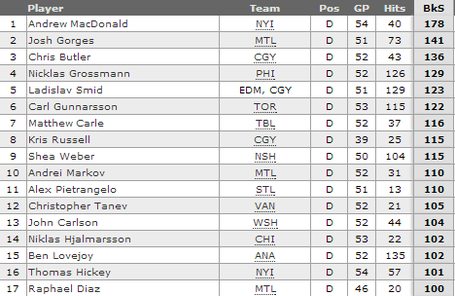
Below are the 2013-2014 league leaders in blocked shots:
While there are some good defenseman on the list–and even some studs–there are also just a lot of “guys”. Ask yourself again, what is this measuring, and what isn’t it measuring? Could there be team effects here? For example, the Calgary Flames have three players in the top eight. What is more likely, that the Calgary Flames have three of the league’s best defenseman, or that perhaps the Calgary Flames defenseman have more opportunities to block shots because they are frequently outplayed?
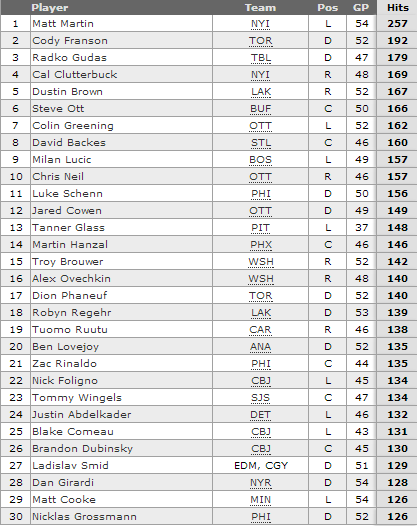
Below are the 2013-2014 league leaders in hits:
Much like with blocked shots, we do have a few very good players on the list; but we still also have “just a lot of guys”.
Dallas Eakins of the Edmonton Oilers had his team’s toughness questioned recently, and he was specifically asked about hits. I would argue that his response could be applied to both hits and blocked shots.
“You know what the perfect game is? The perfect game is no hits. You know why that is? It’s because you have the puck. You don’t have to hit anybody. You have the puck.”
The inverse of his statement would be true as well. If you don’t have the puck then you’ll have plenty of opportunity to wrack up hits and blocked shots.
Shooting Percentage
Shooting percentage may seem like a weird one to include on this list because most fans would rarely directly reference it. In fact, my “overused and overrated” doesn’t really apply here; but I did want to include it as I feel that it’s an important takeaway.
Shooting percentage is a large driver of goals (shocker, I know). If Alex Ovechkin or Evgeni Malkin have a year in which their shooting percentage is one or two percentage points higher, that can be three to six extra goals on the season.
If there’s ever been a surprise player who’s near the top of the league in goals, it will very frequently be because of an abnormally high shooting percentage for them. Therefore, it’s typically not uncommon to expect a dropoff.
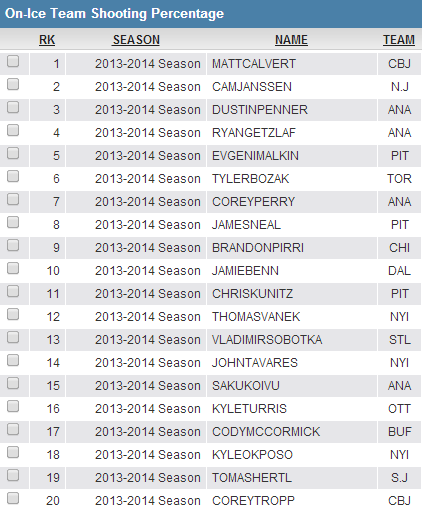
The takeaway here is that shooting percentage includes quite a bit of luck. If shooting percentage was entirely about talent then you wouldn’t see some of these names at the top of the league in five-on-five shooting percentage.
Seriously, Matt Calvert and Cam Janssen lead the leage in five-on-five shooting percentage.
Conclusion
I always get a little disheartened when I see the next iteration of the”advanced stat” versus “traditionalists” debate. I encourage everyone, whether you’re a casual fan who loves plus/minus, or an analytics endorser who dreams of Corsi and WOWY, to question what it is you think you know.
It doesn’t matter what statistic you are referencing. Ask yourself “what does this actually measure?” and “what doesn’t this measure?”. Think about what drives those metrics from a hockey perspective, and how the statistic could be flawed. Statistics aren’t something to be looked at in a vacuum. They need the proper context. I would argue the statistics above are cited far too frequently by people who are not framing them in the proper context.


