


You may have heard that things have been going a bit better for the Flyers in the past couple of weeks. They’re on a seven-game point streak, with six wins and just a single shootout loss in that time. The run that the orange and black are currently on brought them from 28th in the league to firmly back in the playoff chase.
There are a lot of reasons for that turnaround. Good goaltending: Steve Mason and Ray Emery have been outstanding the last couple of weeks. Good coaching: Craig Berube’s had a lot of last change lately with the Flyers playing so many home games, and as such he’s received a lot of credit for matching lines well. Regression: a team with this many good offensive players wasn’t going to be terrible forever.
But there’s another thing that you won’t hear a lot about that’s as important of all: the Flyers, as a possession team, have been much, much better the last couple of weeks.
To quickly recap, if you’re new to these numbers or need a refresher: possession in hockey is basically defined by the number of shot attempts a team gets towards the other team’s net at even strength. Teams that have higher possession numbers are ones that typically get more shot attempts to the net, and teams with higher possession numbers are generally, over the long-run, better at things like winning games and making the playoffs.
This works at both a team level and an individual level. Guys who get a majority of the shot attempts while they’re on the ice go a long way towards helping their team win games (and, as it’s been discussed here before, guys who do this regularly can sometimes get undervalued). Though there are often adjustments to be made to the single number, a player’s Corsi-for percentage (the percentage of goals, shots on goal, missed shots and shots blocked on ice that are taken by his team) is typically the way we evaluate his possession ability.
The Flyers’ lineup in their current seven-game run has been the exact same in every game, with the lone exception of Michael Raffl playing in the first game of it and Steve Downie then taking his place for the other six. Here’s how each player in the lineup has seen his Corsi-for percentage trend in the last two weeks, compared to the four or five weeks before them. (See bottom of article for further postscript.)
| Player | Zone-Adjusted* Corsi % pre-11/9 | Zone-Adjusted Corsi % since 11/9 | CHANGE |
| Voracek | 56.14% | 58.09% | 1.95% |
| Giroux | 48.63% | 52.47% | 3.84% |
| Hartnell | 57.36% | 52.41% | (4.95%) |
| B. Schenn | 47.77% | 51.81% | 4.04% |
| Lecavalier | 39.66% | 50.33% | 10.66% |
| Simmonds | 48.40% | 47.79% | (0.62%) |
| Couturier | 49.38% | 55.23% | 5.85% |
| Read | 46.18% | 54.85% | 8.67% |
| Hall | 44.63% | 62.35% | 17.72% |
| Rosehill | 33.57% | 53.06% | 19.49% |
| Rinaldo | 41.31% | 51.37% | 10.05% |
| Timonen | 53.20% | 58.17% | 4.97% |
| Coburn | 48.79% | 54.78% | 5.98% |
| Streit | 47.78% | 49.69% | 1.91% |
| Grossmann | 46.49% | 49.52% | 3.03% |
| L. Schenn | 45.81% | 52.74% | 6.93% |
| Gustafsson | 48.75% | 51.87% | 3.12% |
| TEAM | 48.28% | 52.13% | 3.85% |
(Note: Downie, having only played about one half of one game with the Flyers prior to 11/9, was not included on the chart.)
And for further visualization purposes, here’s that in nifty bar graph form:
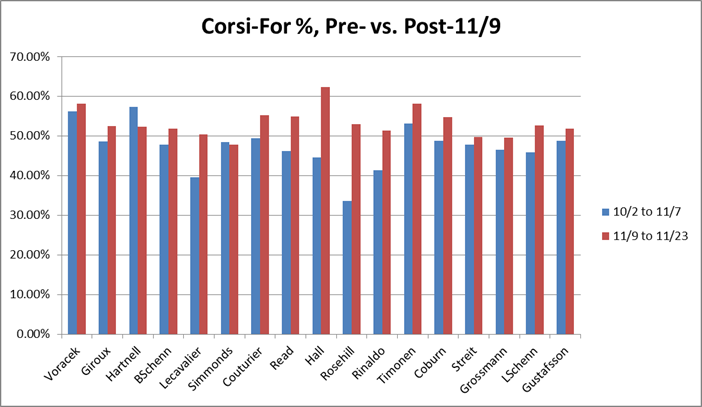
The takeaway here is obvious: of the 17 players who have been with the team all year and have been playing during the team’s hot streak of late, 15 of them have seen their possession numbers improve in the last two weeks, and many of them significantly so.
Some specific thoughts
- Surely by now you’ve heard a lot about the excellence of the Flyers’ third line of late. Though Steve Downie isn’t represented on here, Matt Read and Sean Couturier’s quality play of late is well on display.
- Surprised to see how poorly Vincent Lecavalier’s numbers were to start the year, given how good he’s looked by the eye test all season, but he’s been much better in these last couple of weeks. Ditto Brayden Schenn on that second line, though not quite to the same extent.
- Maybe the best possible sign that things have been going well for the Flyers lately is that their fourth line has been, uh, playing well. Like, actually playing well. Adam Hall’s exploits at the faceoff dot have been well-documented, but the fact that he, Zac Rinaldo and Jay Rosehill pushing play like they have is nothing short of stunning. I’m inclined to think it — moreso than anything else going on here — won’t last long-term, but it’s definitely helped.
- I’ve heard from a lot of people about how bad they think Scott Hartnell has looked lately. I think that gets overexaggerated a bit, but the fact that he’s the only one here who’s seen a significant drop-off during the team’s hot streak is a bit discerning.
- Kimmo Timonen, who we all probably thought should’ve retired back in October after a rough start, has been awesome. Age ain’t nothin’ but a number.
- Luke Schenn, who was reeeeeeally not good to start the year, has been better lately. Good to see.
- Another note: this data includes all 5-on-5 minutes for the Flyers in the games mentioned. Teams typically end up giving up more attempts when they’re in the lead (and, conversely, get more attempts when they trail). The fact that the Flyers have been leading far, far more than they’ve been trailing the last couple of weeks only make the high percentages seen here even more impressive./
Possible explanations
- Circumstance: with the exception of the Penguins (a team that probably controlled the majority of the play in their game against the Flyers) and to a lesser extent the Islanders and Jets, most of the teams the Flyers have been playing lately haven’t been very good (i.e. Oilers, Sabres, Senators). Playing bad teams will typically make you look better. That said, though, seeing the Flyers beat up on bad teams is still encouraging, since they opened up the year not exactly doing that.
- Continuity: Remember when the Flyers were losing games and Craig Berube would throw his lines in a blender every time the Flyers lost? Maybe not shockingly, when the Flyers are winning games, Berube has been keeping his lines the way they are. With the success that the top-9 has seen lately, maybe the guys have had a chance to actually play together and get some cohesion going.
- Coaching: He’s had the advantage of last change in four of those seven games, but Craig Berube’s ability to get the matchups he wants on the ice has been on full display. The Read-Couturier-Downie line has been almost exclusively facing the other team’s top line, the other two scoring lines (Claude Giroux’s and Vincent Lecavalier’s) have been getting their chances offensively, and again, the fourth line’s done well against other fourth lines. If Berube can keep getting the edge on other teams like this, it’ll help a lot.
- Time: On the above note, you could make the case that a team learning a new coach’s system would need some time to make it work on both sides of the ice. A month later, maybe we’re finally seeing it work.
- Natural regression: Let’s be honest here. Claude Giroux was not going to keep being a sub-50% possession player, Vincent Lecavalier was going to do better eventually, Sean Couturier’s always been a good possession player that wasn’t quite seeing it reflected in his results, and basically every player on the Flyers’ blue line was playing below what he was capable of. Not everything we’re seeing above is going to last forever, but some guys were underachieving and it looks like they’re getting it back to what they’re capable of./
A lot has gone right for the Flyers lately. At some point, they’ll lose some games and cool down a bit. They aren’t going to get .930-plus goaltending forever — even if Steve Mason has genuinely improved as a goalie since his arrival here (something that seems more likely with each passing start), that’s too much to expect from him (or any goalie) in the long run.
But some of the underlying numbers of late are definitely encouraging, and if the Flyers are getting and keeping the puck more than their opponents are, that’s going to go a long way towards making sure that the struggles we saw at the beginning of the season were temporary, and solidifying this team as a potential playoff squad.

* For the purposes of this exercise, “Zone-Adjusted Corsi” is calculated by subtracting 0.4 Corsi attempts from the player’s total Corsi-for on the season for each offensive zone start he has taken, and by subtracting 0.4 Corsi attempts from the player’s total Corsi-against on the season for each defensive zone start he has taken. Thanks to our own Eric T. for the tip.


