


Last weekend, Flyers.com writer and friend of the blog Anthony SanFilippo wrote a lengthy defense of the Flyers’ drafting philosophies in recent years, particularly their general policy of going with the best player available on the board rather than for need. If you’re a Flyers fan and you haven’t already read it, you should definitely take the next 5-10 minutes and do so, because it’s very well thought-out and researched.
Anywho, the piece was mostly geared towards those saying that this draft policy is what’s led to the current state of the Flyers’ defense. On that front, SanFillippo brought up a fact that I hadn’t seen before: of all of the top-6 defensemen in the NHL right now, only 34.4% of them were picked in the draft by the team that they currently play for. In the comments on last Monday’s Fly By, we got to wondering what those percentages looked like for forwards and goalies.
Based on the top 13 forwards, top 7 defensemen, and top 2 goalies on each NHL team this year (by games played), here’s what the 22-man composition of the average NHL team is.
| Draft pick | Trade | FA | UDFA | Waivers | |
| All (F/D/G) | 8.53 | 6.43 | 5.23 | 1.10 | 0.70 |
| Forwards | 5.33 | 3.53 | 2.97 | 0.60 | 0.57 |
| Defensemen | 2.37 | 2.43 | 1.70 | 0.40 | 0.10 |
| Goalies | 0.83 | 0.47 | 0.57 | 0.10 | 0.03 |
What that means: the average team has 8.53 players that were draft picks of its own, 2.43 defensemen that were acquired via trade, 0.57 forwards that it plucked off of waivers from another team, etc. (Note: I only counted players as “draft picks” if they were on their current team since being drafted. For instance, Simon Gagne would count not as a Flyers draft pick by this method, but a traded player.)
To put that into percentage form, the way SanFilippo did (and combining unrestricted free agents, undrafted free agents, and waiver claims into one category for simplicity’s sake):
| Draft pick | Trade | FA/UDFA/Waivers | |
| All (F/D/G) | 38.8% | 29.2% | 32.0% |
| Forwards | 41.0% | 27.2% | 31.8% |
| Defensemen | 33.8% | 34.8% | 31.4% |
| Goalies | 41.7% | 23.3% | 35.0% |
So it looks like marginally more forwards/goalies are brought to teams via the draft when compared to defensemen, while on the other side it appears that slightly more defensemen are at their current teams via trades.
Those are the league averages. How does it shake out for each individual team? (Click to enlarge. “All FA” refers to all of FA/UDFA/Waivers.)
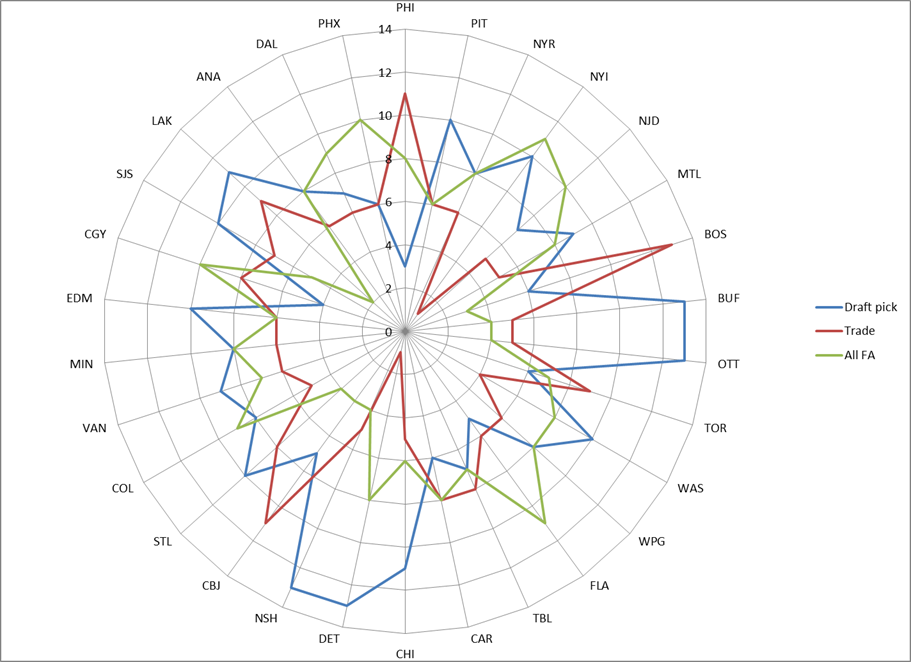
So you can see there how each team obtained its top 22 players from the 2013 season, and how some chose to do it in different ways than others. You see the Flyers, who used fewer draft picks than any team in the league. They also relied on trades as much as anyone, similarly to Boston and Columbus. Then there are teams like Buffalo or Ottawa or Detroit, who have more draft picks on their team than anyone else. Or ones like Florida or the Islanders, who use a lot of free agents/waiver claims to fill their roster. Everyone looks a little bit different.
As far as how each team obtained those players by position…
| Forwards | Defensemen | Goalies | |||||||
| Team | Draft pick | Trade | All FA | Draft pick | Trade | FA | Draft pick | Trade | All FA |
| PHI | 3 | 5 | 5 | 0 | 4 | 3 | 0 | 2 | 0 |
| PIT | 6 | 4 | 3 | 3 | 1 | 3 | 1 | 1 | 0 |
| NYR | 5 | 3 | 5 | 2 | 3 | 2 | 1 | 0 | 1 |
| NYI | 7 | 0 | 6 | 2 | 1 | 4 | 1 | 0 | 1 |
| NJD | 4 | 3 | 6 | 2 | 2 | 3 | 1 | 0 | 1 |
| MTL | 5 | 3 | 5 | 3 | 2 | 2 | 1 | 0 | 1 |
| BOS | 5 | 6 | 2 | 1 | 5 | 1 | 0 | 2 | 0 |
| BUF | 7 | 3 | 3 | 4 | 2 | 1 | 2 | 0 | 0 |
| OTT | 10 | 2 | 1 | 3 | 1 | 3 | 0 | 2 | 0 |
| TOR | 4 | 4 | 5 | 1 | 5 | 1 | 1 | 0 | 1 |
| WAS | 4 | 3 | 6 | 4 | 1 | 2 | 2 | 0 | 0 |
| WPG | 4 | 4 | 5 | 3 | 2 | 2 | 1 | 0 | 1 |
| FLA | 2 | 4 | 7 | 2 | 2 | 3 | 1 | 0 | 1 |
| TBL | 5 | 4 | 4 | 2 | 3 | 2 | 0 | 1 | 1 |
| CAR | 3 | 5 | 5 | 2 | 3 | 2 | 1 | 0 | 1 |
| CHI | 7 | 3 | 3 | 3 | 2 | 2 | 1 | 0 | 1 |
| DET | 8 | 0 | 5 | 4 | 1 | 2 | 1 | 0 | 1 |
| NSH | 7 | 4 | 2 | 5 | 1 | 1 | 1 | 0 | 1 |
| CBJ | 5 | 5 | 3 | 1 | 5 | 1 | 1 | 1 | 0 |
| STL | 7 | 4 | 2 | 3 | 3 | 1 | 0 | 1 | 1 |
| COL | 7 | 1 | 5 | 1 | 3 | 3 | 0 | 1 | 1 |
| VAN | 6 | 3 | 4 | 2 | 2 | 3 | 1 | 1 | 0 |
| MIN | 4 | 5 | 4 | 3 | 1 | 3 | 1 | 0 | 1 |
| EDM | 8 | 2 | 3 | 1 | 4 | 2 | 1 | 0 | 1 |
| CGY | 2 | 4 | 7 | 1 | 3 | 3 | 1 | 1 | 0 |
| SJS | 5 | 5 | 3 | 4 | 2 | 1 | 1 | 0 | 1 |
| LAK | 6 | 7 | 0 | 3 | 2 | 2 | 2 | 0 | 0 |
| ANA | 7 | 3 | 3 | 1 | 3 | 3 | 0 | 0 | 2 |
| DAL | 4 | 4 | 5 | 2 | 1 | 4 | 1 | 1 | 0 |
| PHX | 3 | 3 | 7 | 3 | 3 | 1 | 0 | 0 | 2 |
(In the interest of not bogging down the page with tables too much, here’s a chart with the individual breakdown of unrestricted free agents/undrafted free agents/waiver claims for each team.)
Some things may stick out there — for instance, as it’s been pointed out before, the fact the the Flyers are the only team in the league without a drafted defenseman on their roster — but it’s clear that every team, successful or not, compiles their roster a bit differently.
But is there any sort of secret to assembling a Cup-winning team? Do the teams that have won the Cup since the full-season lockout have any particularly noticeable trends?
| Team | Draft pick | Trade | FA/UDFA/Waivers |
| 2012 LAK | 11 | 7 | 4 |
| 2011 BOS | 6 | 11 | 5 |
| 2010 CHI | 9 | 5 | 8 |
| 2009 PIT | 9 | 6 | 7 |
| 2008 DET | 10 | 4 | 8 |
| 2007 ANA | 3 | 10 | 9 |
| 2006 CAR | 5 | 10 | 7 |
| Average | 7.57 | 7.57 | 6.86 |
Nope. In fact, the squads that have recently won the Cup had slightly less players than average that were obtained via the draft, and slightly more than average that were obtained via trade or free agency. Not to mention, two of them — the 2011 Bruins and the 2007 Ducks — were in the exact same defensive situation that the Flyers are in, in the sense that none of their top 7 playoff defensemen were drafted by the team.
The Flyers need a No. 1 defenseman. We’ve talked about this, and until it happens they probably aren’t going to seriously contend for a Cup again. But as we’ve also talked about, there’s more than one way to obtain that guy, and it doesn’t just come down to hitting a home run in the draft.
Would I like the Flyers to be better at drafting defensively? Of course. Good young players on entry level contracts do you wonders in this league. But that’s not the only way it works, which brings us back to SanFilippo’s point: the fact that the Flyers’ defense isn’t made up of their own draft picks is hardly the reason why their D has struggled the way that it has.


