


Let’s take a look back at a happier time. It might not be pertinent now, but the numbers from the Penguins series are still interesting. — Travis
It goes without saying that this series was full of open hockey and plenty of scoring chances. Often it appeared that neither team’s defense really cared about opposing players with or without the puck skating free in the slot and that’s reflected in the scoring chance results. A typical Flyers game usually has 25-30 chances total from both teams; the Flyers and Penguins on average had 35 chances per game. Two excellent attacking teams with lots of powerplay time and often shoddy defending led to the high number of chances. Combine that with abysmal goaltending and you get a ridiculously high scoring series.
A game chance breakdown shows how both teams went through each period, at even strength and on special teams. These could be considered as rough indicators of how the teams played in each game and whether it was closer than the score suggests. Usually, but not always, the team that gets the most chances wins.
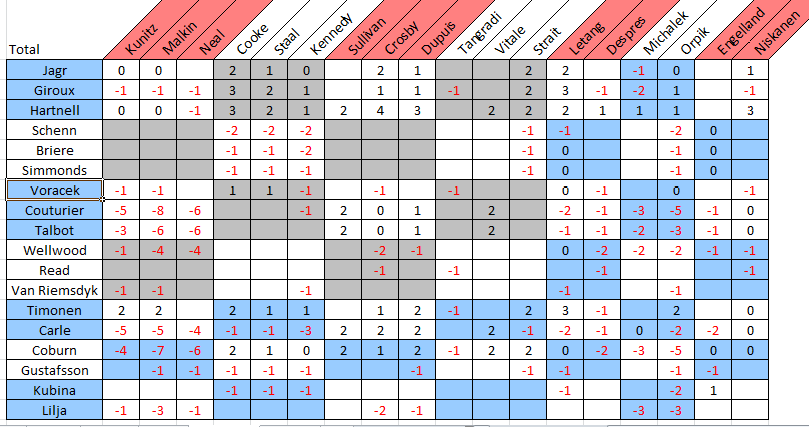
Much had been made of the matchups before the series, and during the series a big topic was how Sean Couturier was shutting down Evgeni Malkin. The head to head matchup charts show the even strength chance differential between opposing players and can add to/back up what many see happening during the game. It’s roughly presented as line vs. line but on a finer scale you can see how individual players performed against each other, such as Couturier vs. Malkin or Giroux vs. Crosby.
After the jump is a game by game breakdown of total scoring chances and the head to head matchups. There is a lot to take in here, so mostly I’ve just presented the numbers as they are for digestion. Additonally, there is a quick look at how Ilya Bryzgalov and Marc-Andre Fleury did against scoring chances (Hint: not well).
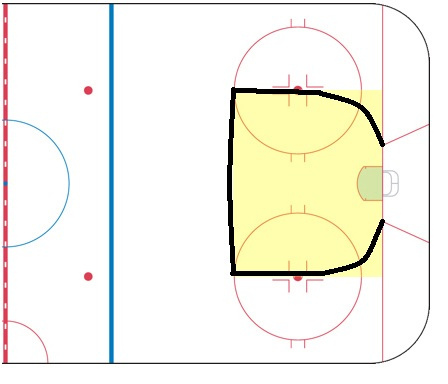
Scoring chance definition
A scoring chance is defined as a clear play directed toward the opposing net from a dangerous scoring area — loosely defined as the top of the circle in and inside the faceoff dots (see below), though sometimes slightly more generous than that depending on the amount of immediately-preceding puck movement or screens in front of the net.
Blocked shots are generally not included but missed shots are. A player is awarded a scoring chance anytime he is on the ice and someone from either team has a chance to score. He is awarded a “chance for” if someone on his team has a chance to score and a “chance against” if the opposing team has a chance to score.
Scoring chance area
Total chances
| Period | CF | CA | ESCF | ESCA | PPF | SHA | 5v3PPF | 5v3SHA | SHF | PPA | 5v3SHF | 5v3SHA |
| 1 | 40 | 40 | 17 | 29 | 14 | 0 | 5 | 0 | 4 | 11 | 0 | 0 |
| 2 | 32 | 36 | 18 | 17 | 10 | 0 | 0 | 0 | 4 | 19 | 0 | 0 |
| 3 | 31 | 23 | 22 | 16 | 9 | 1 | 0 | 0 | 0 | 6 | 0 | 0 |
| Totals | 103 | 99 | 57 | 62 | 33 | 1 | 5 | 0 | 8 | 36 | 0 | 0 |
CF, chances for; CA, chances against; ESCF, even strength chances for; ESCA, even strength chances against; PPF, powerplay for; SHA, shorthanded against; SHF, shorthanded for; PPA, powerplay against.
Total chances suggest the teams were very close and, as many people predicted, the Flyers weren’t quite as good as the Penguins at even strength. The Flyers were great on special teams. In 23 powerplay opportunities they generated 38 chances, or 1.65 chances per powerplay, and allowed only 1 shorthanded chance. The Penguins had 29 powerplay opportunities and generated 36 chances, or 1.24 chances per powerplay, as well as allowing 8 shorthanded chances. Credit to the Flyers penalty kill.
Game 1 – Flyers win 4-3 in OT
| Period | Totals | EV | PP | 5v3 PP | SH | 5v3 SH | ||||||
| 1 | 5 | 8 | 5 | 8 | 0 | 0 | 0 | 0 | 0 | 0 | 0 | 0 |
| 2 | 3 | 5 | 3 | 2 | 0 | 0 | 0 | 0 | 0 | 3 | 0 | 0 |
| 3 | 8 | 3 | 7 | 0 | 1 | 1 | 0 | 0 | 0 | 2 | 0 | 0 |
| 4 | 0 | 0 | 0 | 0 | 0 | 0 | 0 | 0 | 0 | 0 | 0 | 0 |
| Totals | 16 | 16 | 15 | 10 | 1 | 1 | 0 | 0 | 0 | 5 | 0 | 0 |
A poor start was cancelled out by a great finish, The third period was dominant, allowing the Flyers to come back into the game and gave them a chance to win in OT (where chances weren’t recorded).
Head to head even strength (click to enlarge):
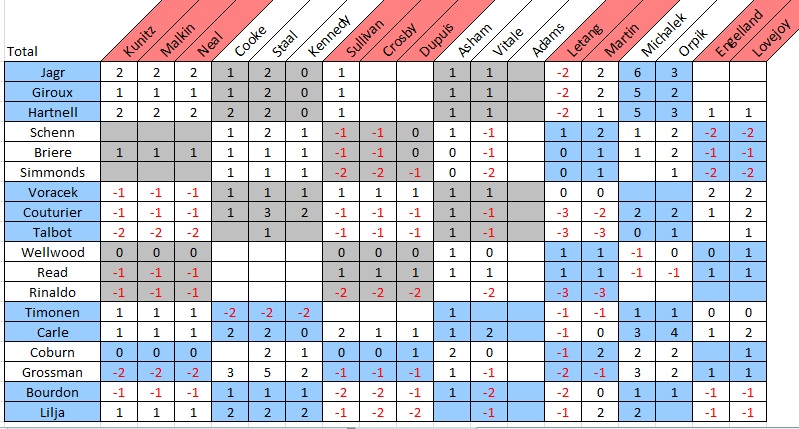
Giroux’s line was great against everybody in this game while Danny Briere’s did what we all hoped and was average. The Couturier-Malkin matchup went slightly in Malkin’s favour, but a 19-year-old getting beaten by 1 chance against one of the best lines in hockey this season could still be considered a win.
For the Penguins, Jordan Staal’s line wasn’t very good and neither was Crosby’s. Zbynek Michalek was thoroughly called out for this game and it’s clear to see why, he was terrible.
Game 2 – Flyers win 8-5
| Period | Totals | EV | PP | 5v3 PP | SH | 5v3 SH | ||||||
| 1 | 4 | 8 | 1 | 5 | 0 | 0 | 0 | 0 | 3 | 3 | 0 | 0 |
| 2 | 9 | 5 | 4 | 1 | 4 | 0 | 0 | 0 | 1 | 4 | 0 | 0 |
| 3 | 4 | 7 | 4 | 7 | 0 | 0 | 0 | 0 | 0 | 0 | 0 | 0 |
| 4 | 0 | 0 | 0 | 0 | 0 | 0 | 0 | 0 | 0 | 0 | 0 | 0 |
| Totals | 17 | 20 | 9 | 13 | 4 | 0 | 0 | 0 | 4 | 7 | 0 | 0 |
This time the slow start wasn’t cancelled out, but the second period helped a lot. The Flyers were great on special teams, getting 4 shorthanded chances to the Pens’ 7 on the powerplay is excellent.
Head to head matchup
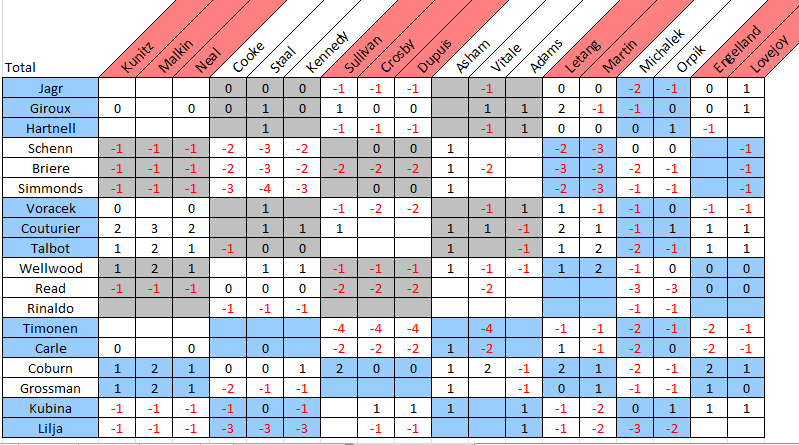
Two things stand out from this chart: Briere and co. were really bad, Couturier et al were really good.
Game 3: Flyers win 8-4
| Period | Totals | EV | PP | 5v3 PP | SH | 5v3 SH | ||||||
| 1 | 8 | 4 | 4 | 2 | 2 | 0 | 2 | 0 | 0 | 2 | 0 | 0 |
| 2 | 6 | 3 | 1 | 2 | 5 | 0 | 0 | 0 | 0 | 1 | 0 | 0 |
| 3 | 3 | 4 | 2 | 2 | 1 | 0 | 0 | 0 | 0 | 2 | 0 | 0 |
| 4 | 0 | 0 | 0 | 0 | 0 | 0 | 0 | 0 | 0 | 0 | 0 | 0 |
| Totals | 17 | 11 | 7 | 6 | 8 | 0 | 2 | 0 | 0 | 5 | 0 | 0 |
This was the first time the Flyers bested the Penguins in the first period chance battle and it was by a healthy margin. It’s not surprising in a game with so many penalties called that there was little in the way of even strength chances; ten powerplay chances is a great effort from the Flyers, as well as limiting the Pens to five on their powerplays.
Head to head
Again, as the head to head shows even strength play, there’s not a lot here.
Game 4: Flyers lose 3-10
| Period | Totals | EV | PP | 5v3 PP | SH | 5v3 SH | ||||||
| 1 | 7 | 9 | 1 | 6 | 4 | 0 | 2 | 0 | 0 | 3 | 0 | 0 |
| 2 | 3 | 13 | 3 | 4 | 0 | 0 | 0 | 0 | 0 | 9 | 0 | 0 |
| 3 | 3 | 3 | 3 | 3 | 0 | 0 | 0 | 0 | 0 | 0 | 0 | 0 |
| 4 | 0 | 0 | 0 | 0 | 0 | 0 | 0 | 0 | 0 | 0 | 0 | 0 |
| Totals | 13 | 25 | 7 | 13 | 4 | 0 | 2 | 0 | 0 | 12 | 0 | 0 |
The Penguins nearly doubled up the Flyers in chances, largely due to a second period where they managed 13 chances with nine on the powerplay. The Penguins also dominated the Flyers at even-strength and for the first time this series didn’t allow a shorthanded chance.
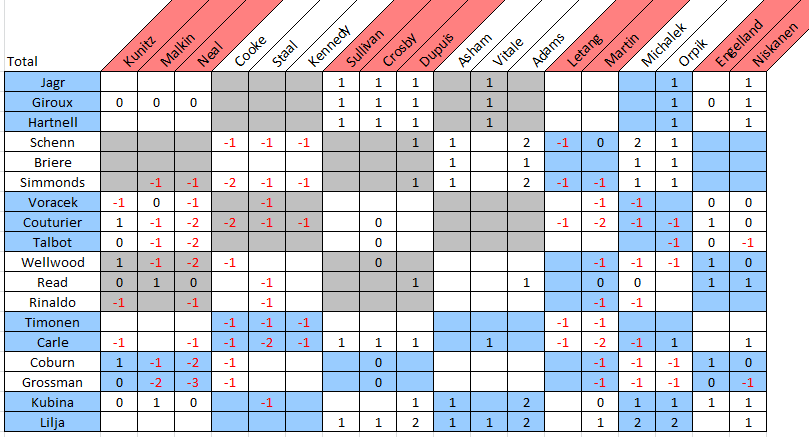
Head to head:

Briere’s line was, by all accounts, terrible. It looks like there was a lot of disadvantageous line matching, which is worrying for a home game.
Game 5: Flyers lose 2-3
| Period | Totals | EV | PP | 5v3 PP | SH | 5v3 SH | ||||||
| 1 | 7 | 6 | 3 | 5 | 2 | 0 | 1 | 0 | 1 | 1 | 0 | 0 |
| 2 | 3 | 5 | 2 | 5 | 1 | 0 | 0 | 0 | 0 | 0 | 0 | 0 |
| 3 | 9 | 3 | 3 | 3 | 6 | 1 | 0 | 0 | 0 | 0 | 0 | 0 |
| 4 | 0 | 0 | 0 | 0 | 0 | 0 | 0 | 0 | 0 | 0 | 0 | 0 |
| Totals | 19 | 14 | 8 | 13 | 9 | 0 | 1 | 0 | 1 | 1 | 0 | 0 |
Despite winning the chance battle, the Flyers lost in a tight game. The third period was full of chances but Fleury played well.
Head to head:
Couturier had played Malkin well up to this point in the series, but this was complete domination by 71. With Nicklas Grossmann out, the combined n’s from Malkin, Neal and Kunitz overwhelmed Braydon Coburn,
Game 6: Flyers win 5-1
| Period | Totals | EV | PP | 5v3 PP | SH | 5v3 SH | ||||||
| 1 | 9 | 5 | 3 | 3 | 6 | 0 | 0 | 0 | 0 | 2 | 0 | 0 |
| 2 | 8 | 5 | 5 | 3 | 0 | 0 | 0 | 0 | 3 | 2 | 0 | 0 |
| 3 | 4 | 3 | 3 | 1 | 1 | 0 | 0 | 0 | 0 | 2 | 0 | 0 |
| 4 | 0 | 0 | 0 | 0 | 0 | 0 | 0 | 0 | 0 | 0 | 0 | 0 |
| Totals | 21 | 13 | 11 | 7 | 7 | 0 | 0 | 0 | 3 | 6 | 0 | 0 |
This game was a clear indication that the Flyers wanted no part in a Game 7 back in Pittsburgh.
Head to head

Giroux’s line (how do we not have a name for them) was again excellent. Couturier and Coburn rebounded from awful Game 5s and played well.
Overall, Giroux’s line was great and Couturier largely held his own when deployed against Malkin (except Game 5). Briere’s line is concerning, they’re nearly always the worst of the top three despite getting the easier starts. We know Lavy uses scoring chances, so it will be interesting to see if any changes are made to this line, especially with James van Riemsdyk coming back.
The defense is a mixed bag, the only real pattern I saw was that Andreas Lilja – Pavel Kubina were usually the worst (by eyeballing anyway). If Andrej Meszaros and Grossmann comeback this series then we might not have to see either of them again as Erik Gustafsson has been o.k. in the last two games.
Goalies
It’s well established that both goalies were pretty bad overall in the series, and this comes through in the scoring chance information also.
Bryzgalov: 80 saves/96 chances = 0.808 chance SV%
Fluery: 79 saves/100 chances = 0.79 chance SV%
Additionally, each goalie allowed five non-chance goals, which in most cases is the equivalent to letting in a softie.
For more on how Bryz and Fleury stack up against other playoff goalies, check out the work by Adam Gretz here. Adam is looking at scoring chances against all goalies in the playoffs (which is a heck of an effort). His numbers differ from mine but the message is the same; Bryzgalov and Fleury were terrible.


