


A week ago, Todd presented the season-long scoring chance numbers he tirelessly compiled from last year.
Continuing with his work, I was able to go through and further splice his data to separate out team strength. Where Todd did a great job of breaking down even strength contributions, I will break down power play and shorthanded contributions.
Here, we will look at three parts of shorthanded play: 1) The number of scoring chances for the Flyers with each player on the ice, adjusted for 200 minutes; 2) The number of scoring chances attributed to each player per 200 minutes; and 3) The number of scoring chances against the Flyers with each player on the ice, per 200 minutes.
Why 200 minutes? If a player averages two and a half minutes of penalty kill time per game for a full 82-game season, he will have amassed 205 minutes of shorthanded ice time on the year. Since Couturier, Read and Giroux hovered around 2:30 per game — as well as it being a nice round number that captures a noticeable difference between the forwards — it seemed a reasonable figure to adjust to. It is arbitrary, but it at least makes some sense.
Forwards
SH TOI – Total ice time spent shorthanded; SH TOI/G – Average shorthanded ice time per game; ISC/200 – Individual scoring chances per 200 minutes; SH SCF/200 – Team scoring chances for per 200 minutes; SCA/200 – Team scoring chances against per 200 minutes; SC Dif/200 – Team scoring chance differential per 200 minutes; SC% – Team scoring chance percentage
| SH TOI | SH TOI/G | ISC/200 | SH SCF/200 | |
| Claude Giroux | 172:54 | 2:15 | 11.57 | 33.55 |
| Maxime Talbot | 268:29 | 3:19 | 11.92 | 32.03 |
| Jakub Voracek | 43:07 | 0:33 | 18.55 | 27.83 |
| Eric Wellwood | 34:19 | 1:29 | 17.48 | 23.31 |
| Sean Couturier | 204:17 | 2:37 | 9.79 | 19.58 |
| Andreas Nodl | 22:39 | 1:53 | 17.66 | 17.66 |
| Matt Read | 205:21 | 2:36 | 10.71 | 17.53 |
Limited to those forwards with a minimum of 0:30 shorthanded ice time per game and minimum of 20 shorthanded minutes played.
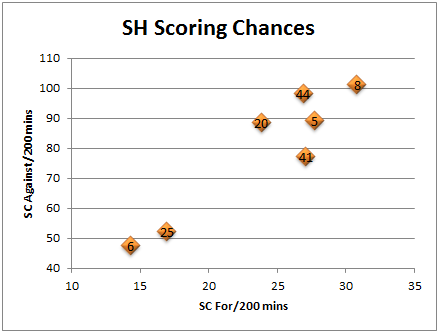
Focusing on offense generated first, last year, the Talbot-Giroux duo was clearly the most dangerous PK unit the Flyers had, as the Flyers generated over 32 scoring chances per 200 minutes of play with them on the ice, significantly outpacing the rookie-duo of Couturier-Read.
In a limited sample, both Eric Wellwood and Jakub Voracek proved dangerous on the penalty kill as well, generating 23 and 27 scoring chances per 200 minutes. The trio of Voracek, Wellwood and Nodl each averaged roughly one scoring chance per 11 minutes, helping to account for their much higher individual chances per 200. It will be interesting to see if Wellwood and Voracek continue to kill penalties next year, and if they can continue being as dangerous.
| SH TOI | SH TOI/G | SCA/200 | SC Dif/200 | SC% | |
| Jakub Voracek | 43:07 | 0:33 | 64.94 | -37.11 | 30.00% |
| Matt Read | 205:21 | 2:36 | 74.99 | -57.46 | 18.95% |
| Sean Couturier | 204:17 | 2:37 | 75.39 | -55.8 | 20.62% |
| Andreas Nodl | 22:39 | 1:53 | 79.47 | -61.81 | 18.18% |
| Maxime Talbot | 268:29 | 3:19 | 87.16 | -55.12 | 26.88% |
| Claude Giroux | 172:54 | 2:15 | 90.23 | -56.68 | 27.10% |
| Eric Wellwood | 34:19 | 1:29 | 104.91 | -81.59 | 18.18% |
Turning to scoring chance suppression, we see how well each player did at preventing scoring chances against the Flyers’ net while shorthanded. While Wellwood was a threat on offense, he also gave up a disproportionate amount of scoring chances against. This does not bode well for continued penalty kill time, though again, it is an incredibly small sample. I’m also interested to see if Nodl’s strong penalty killing in a few minutes here carried over to Carolina.
Voracek, meanwhile, appears quite strong here as well. With the same small sample size caveats as Wellwood, Voracek was significantly better at preventing scoring chances than the rest of the Flyers’ penalty killers. Coupled with his ability to generate scoring chances, he appears to be a fantastic part-time penalty killer.
Interestingly, while Talbot and Giroux were a very dangerous duo offensively, the rookies — Matt Read and Sean Couturier — were noticeably better at preventing scoring chances. While part of that may be that Talbot-Giroux faced first power play units, the two quality of competition metrics available to us show that Read and Couturier faced the tougher competition, for whatever that is worth.
It is only 200 minutes, but the defensive acumen of Read and Couturier shines through here. It may not be a large difference — essentially, it is one fewer scoring chance every five games — and it may not be statistically significant, but it was quite an impressive feat.

While it certainly appears at first glance that the offense brought by Talbot and Giroux is more than the defense brought by Read and Couturier, that is simply a matter of scale. Both pairings had a scoring chance differential of between 55 and 57. The difference is that the rookies suppressed scoring chances at both ends compared to Talbot and Giroux.
That alone is fairly remarkable. Both forward units had roughly the same scoring chance differential, despite going about it in much different ways. While Talbot-Giroux played a more wide-open, arguably more aggressive, style, they gave up 55 more scoring chances than they generated. Read-Couturier, on the other hand, played a more stingy, arguably conservative, style and gave up 55 more scoring chances than they generated.
For posterity sake, the standard error on scoring chances against per 200:
| +/- | |
| Voracek | 17.36 |
| Read | 8.55 |
| Couturier | 8.59 |
| Nodl | 26.49 |
| Talbot | 8.06 |
| Giroux | 10.22 |
| Wellwood | 24.73 |
As you can see, the small sample sizes involved in Nodl, Wellwood and Voracek’s ice time creates a good bit of uncertainty surrounding their figures. To illustrate: if the entirety of Voracek’s standard error is applied against him, he would surrender 82.3 scoring chances per 200 minutes. If the entirety of Giroux’s standard error is applied in his favor, he would surrender 80 scoring chances per 200 minutes, resulting in Voracek allowing 2.3 more scoring chances against per 200 minutes than Giroux.
In short, based on last year, we can be fairly confident that Voracek is no worse of a penalty killer than Giroux. He may even be significantly better.
Defense
| SH TOI | SH TOI/G | SCA/200 | SC Dif/200 | SC% | |
| Andreas Lilja | 42:03 | 0:55 | 47.56 | -33.29 | 23.08% |
| Matt Carle | 141:34 | 1:44 | 52.27 | -35.32 | 24.49% |
| Andrej Meszaros | 147:41 | 2:23 | 77.19 | -50.11 | 25.97% |
| Chris Pronger | 58:48 | 4:31 | 88.44 | -64.63 | 21.21% |
| Braydon Coburn | 260:02 | 3:13 | 89.22 | -61.53 | 23.68% |
| Kimmo Timonen | 252:45 | 3:20 | 98.12 | -71.22 | 21.52% |
| Nicklas Grossmann | 45:27 | 2:04 | 101.21 | -70.41 | 23.33% |
Limited to those defensemen with a minimum of 0:30 shorthanded ice time per game and minimum of 40 shorthanded minutes played.
Turning now to defensemen, we see a pretty large spread in scoring chance suppression. We also have three players with under 60 minutes of shorthanded ice time, all with varying results. Lilja appears the best here, giving up fewer than 48 scoring chances per 200 minutes, less than half as many as Grossmann gave up in roughly the same amount of ice time.
Unfortunately, because Grossmann switched teams, we are unable to isolate his competition metrics. As they are, Grossmann faced weaker competition than Lilja at 4 on 5, suggesting competition is not the reason for the large disparity in scoring chances. In the limited sample of last season, Lilja was a fine penalty killer and Grossmann was a poor penalty killer.
The presumed second pairing of Matt Carle and Andrej Meszaros both did remarkably well in limiting scoring chance. We again are not talking about a particularly large sample, but Carle gave up just over 52 scoring chances per 200 minutes, more than 30 fewer than Coburn or Timonen.
Coburn and Timonen, meanwhile, gave up 89 and 98 scoring chances per 200 minutes, respectively. While competition metrics do point to Coburn facing tougher competition, the gap is fairly modest. Timonen, meanwhile, has a split in his competition metrics, suggesting there is something beyond competition accounting for the large amount of chances surrendered while he was on the ice. That something could easily be noise, but since we are not drawing conclusions about individual talents, we can simply be amazed at the performance by Lilja and Carle.
And here we see just how far away Lilja and Carle are as outliers, both in generating chances and in surrendering them. Unlike with the forwards, however, the spread here actually is fairly large and is not merely an illusion of scale. The Flyers’ scoring chance differential with Carle on the ice was 15 better than with Meszaros, who himself had a differential 10 better than Coburn, who was also ten better than Grossmann.
And here are the standard errors on defensemen:
| +/- | |
| Lilja | 15.04 |
| Carle | 8.59 |
| Meszaros | 10.22 |
| Pronger | 17.34 |
| Coburn | 8.28 |
| Timonen | 8.81 |
| Grossmann | 21.10 |
We again see small sample size problems appear in regards to Lilja, Pronger and Grossmann, which we mentioned at the beginning of this section. Matt Carle sure does look good, once again, though.
Conclusion
Looking at the forwards, we generally affirm what our eyes had already told us: Read and Couturier were great on the PK while Giroux and Talbot were offensively dangerous while shorthanded. Perhaps next year we can get a better sense of Voracek’s skills, but it looks like he can be an effective penalty killer.
On defense, however, the numbers run counter to what most would have believed. The Flyers’ three most celebrated penalty killers — Grossmann, Timonen and Coburn — gave up more scoring chances than the less heralded trio of Lilja, Carle and Meszaros. While competition metrics provide some explanation as to why Coburn is slightly worse than team average, the competition metrics provide no solace to Grossmann or Timonen.
This does appear to be slightly worrisome, as the Flyers will be without their three best defensive penalty killers next year for an extended period of time. After losing Carle to free agency and Meszaros to an Achilles tear, the highly effective second PK unit from last year is no more. Perhaps Lilja could have filled in admirably, as he did last year, but he also is going to miss some time recovering from hip surgery.
That means the Flyers will be relying on Grossmann to either prove last season was not an accurate reflection of his talent or to significantly improve upon his play while a man down; on Timonen to not only avoid a decline, but to improve; and on Luke Schenn to limit scoring chances against even half as well as Carle did.
Otherwise, Ilya Bryzgalov’s already-poor 0.845 save percentage with a man down will struggle to improve.


