


A new statistic has evolved in the community over the last several weeks. It’s called Balanced Zone Shifts (BZS) and aims to look at how good players are at moving the play from the defensive end to the offensive end.
After the jump, we’ll walk through how it came about and how we might use it.
At behindthenet.ca, you can look up how often a player starts a shift with an offensive or defensive zone faceoff (offensive zone start %, or OZ%) and how often he ends it with an offensive or defensive zone faceoff (offensive zone finish %, or OZF%).
When those stats were first collected by Vic Ferrari, a natural thought was “let’s see who finishes in the offensive zone more than they start there — those might be guys who move the play up the ice.” But there’s a problem with that: it’s a lot easier for the coach to control where he sends the players to start their shifts than it is for the players to control where they finish the shifts.
Bruce McCurdy showed what the issue was with this table:
| Bracket | OZS% | AdjOZF% | ZoneShift |
| 35-39.9 | 38.4 | 46.5 | 8.1 |
| 40-44.9 | 43.2 | 48.1 | 4.9 |
| 45-49.9 | 47.9 | 49.1 | 1.2 |
| 50-54.9 | 52.3 | 50.8 | -1.5 |
| 55-59.9 | 56.8 | 52.1 | -4.7 |
| 60-64.9 | 62.2 | 50.9 | -11.3 |
People with between 35-39.9% offensive zone starts finished in the offensive zone 46.5% of the time. People with between 60-64.9% offensive zone starts finished in the offensive zone 50.9% of the time. Because it’s much easier for a coach to control a guy’s starts than for the player to control where he finishes, the zone finishes end up much closer to 50-50 than the zone starts, which means a guy’s usage has too much impact on his zone shift results — the defensive players will look good and the offensive players will look bad, regardless of their actual skill.
So a simple zone shift metric of (finishes – starts) didn’t work out very well. And that’s where things stayed for six months, until Bettman’s Nightmare had an idea on how to normalize things to get fair comparisons.
The idea was that if we’re struggling to use zone shifts because there’s too much influence from how you’re used, let’s just see whether you do better or worse than other players used the same way. We’ll use the column on the right from the above table as our expected zone shifts and ask whether a player beats those expectations.
Actually, that table was a little too coarse, so he collected a lot more data and produced this chart:
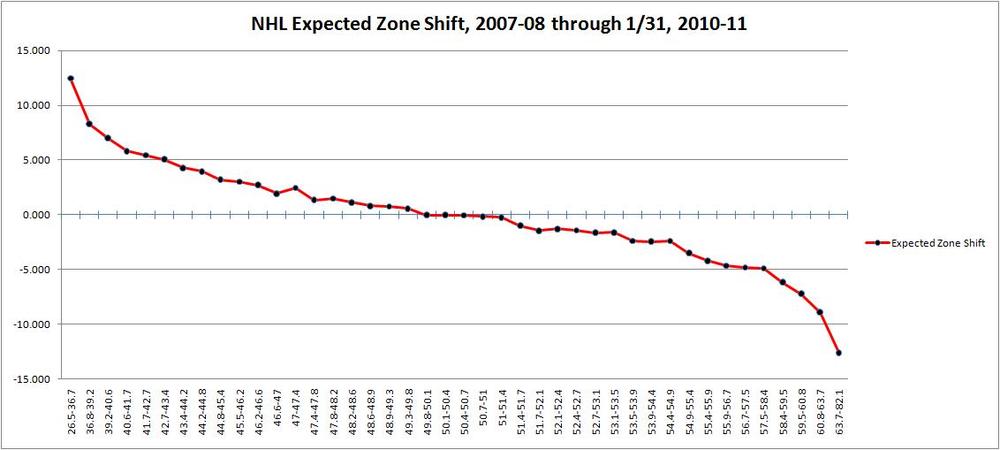
The x-axis has a player’s offensive zone start percentage — his usage — and the y-axis has the expected zone shift for a player with that usage. The next step was to start seeing who did better or worse than what you’d expect.
For example, Ville Leino has a 60.4% OZ% this year, so from this chart we’d expect a simple zone shift of -7.5 if he’s performing the same as other people who get around 60% OZ starts. That means we’re expecting his OZ finishes to be around (60.4 – 7.5) = 52.9%. He’s actually finishing in the offensive zone 49.9% of the time — 3% less than we’d expect, so his Balanced zone shift (BZS) score is -3.
On the other hand, Andreas Nodl’s 44.5% OZ% means we’d expect 48.5% OZ finishes, so his actual 51.7% OZ finishes gives him a BZS score of (51.7 – 48.5) = 3.2; Nodl is doing much better than his similarly-used peers at pushing the play up the ice.
Here’s how the Flyers are doing this year:
| Player | Actual zone finishes | Expected zone finishes | Balanced zone shifts |
| Nodl | 51.7 | 48.5 | 3.2 |
| Carter | 50.6 | 48.0 | 2.6 |
| Giroux | 52.2 | 49.7 | 2.5 |
| Carcillo | 49.2 | 47.1 | 2.1 |
| Powe | 48.1 | 46.6 | 1.5 |
| van Riemsdyk | 51.2 | 50.4 | 0.8 |
| Richards | 49.5 | 48.8 | 0.7 |
| Betts | 44.3 | 45.5 | -1.2 |
| Briere | 49.8 | 51.3 | -1.5 |
| Zherdev | 47.8 | 49.5 | -1.7 |
| Hartnell | 49.4 | 51.1 | -1.7 |
| Versteeg | 49.3 | 51.5 | -2.2 |
| Leino | 49.9 | 52.9 | -3.0 |
| Shelley | 40.5 | 46.6 | -6.1 |
| Pronger | 50.4 | 49.9 | 0.5 |
| Timonen | 49.7 | 49.6 | 0.1 |
| Carle | 49.7 | 49.6 | 0.1 |
| Coburn | 49.6 | 49.9 | -0.3 |
| O’Donnell | 48.0 | 48.5 | -0.5 |
| Meszaros | 47.4 | 48.0 | -0.6 |
| Boynton | 46.1 | 50.1 | -4.0 |
My biggest takeaway from this new way of looking at things is that the Flyers seem to be much better at moving the puck out of the defensive zone than they are at keeping it in the offensive zone. Their offensive line — HBL — is doing much worse than their offensively-deployed peers on other teams at keeping the play forwards. But the heavier lifters — Nodl, Carter, and Giroux in particular — are doing a better job than other team’s defensive lines at moving the puck forwards.
So that’s the ballad of balanced zone shifts. We still don’t have a great way to see who’s the best overall at moving the puck up the ice, but BZS is a nice way to see who outperforms their similarly-used peers — who’s doing particularly well in the role they’ve been given.
P.S. Geoff won’t let me publish this article until I point out that BZS is another piece of evidence that it’s ridiculous to scratch Nodl and play Shelley.


