


After looking at whether or not conventional wisdom about how teams play in front of their starting and backup goalies in an attempt to notice differences, I decided to look back over the last four seasons.
If you recall, I used Fenwick information available at Behind the Net to look at how teams control play. Why Fenwick? Well, it’s what Behind the Net has available (there are no blocked shot data). But since Fenwick percentage has been found to correlate strongly with scoring chances and offensive zone time, this isn’t a problem.
For the four years, I once again removed teams who had acquired a goalie during the season to avoid having their previous team influence their data. In all, it left twenty-six teams in three of the four years, with twenty-five teams in the remaining year.
Jump for the yearly breakdown and the four-year aggregate.
Going in chronological order means we start with 2009-10, which also happens to be the year that most closely matches up with conventional wisdom.

In 09-10, teams were no better at generating offense in front of their starter than their backup, as they had an average improvement of 0.09 shots per sixty minutes when their better goalie was in net. The median value was 0.28 shots per sixty better.

Teams even did better at preventing shots getting through to their starting goalie in 09-10, improving by an average of 0.62 shots per sixty. The median score, however, was 0.34 shots per sixty better.

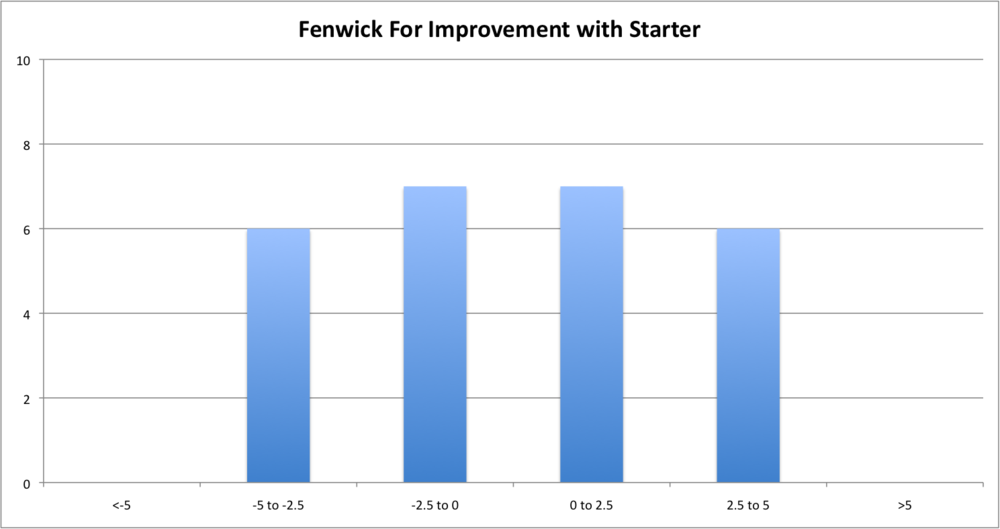
Taken as a whole, teams improved their Fenwick ratio by 0.77 shots per sixty, with the median sitting at 0.64, when their starting goalie was in net.
In 2009-10, teams played better in front of their starting goalies. This is the only year in the last four years that this is true.
2008-09
Teams were quite similar in 2008-09 – at least in range distribution – but the average NHL team received 0.52 shots for per sixty less with their starters in net than with their backups. The median team was 0.59 shots for worse per sixty with their starter in net.

While NHL teams gave up fewer shots with their starter in net – again, against conventional wisdom – it was only by an average of 0.04 shots per sixty. The median team gave up half a shot less with their starter than their backup.
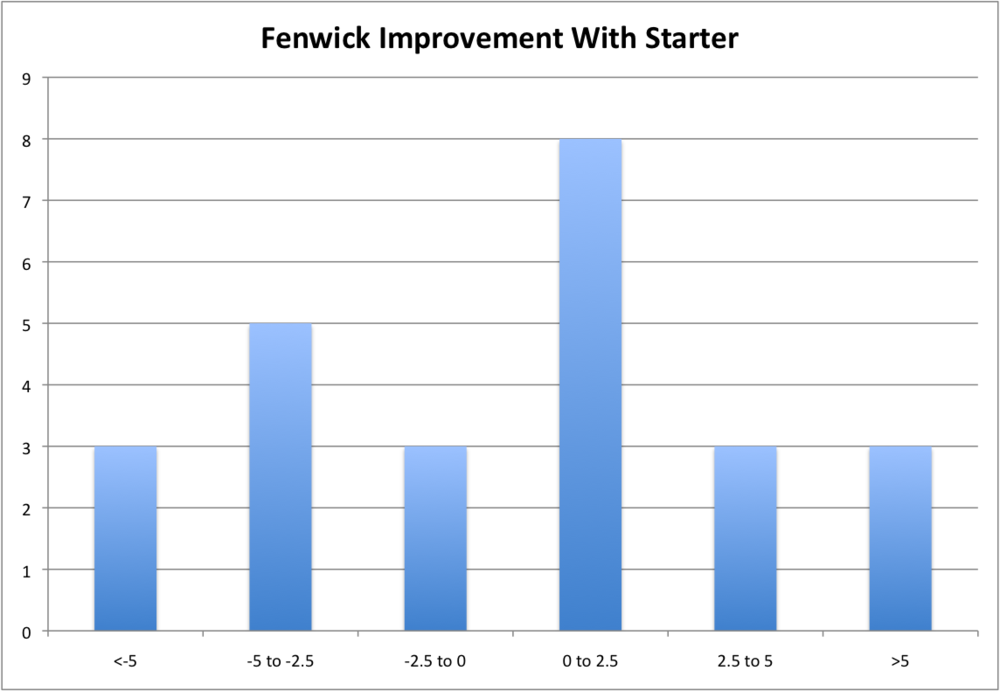
Put it all together, and

The average NHL team was 0.55 Fenwick per sixty better at controlling play with their backups while the median NHL team was 1.35 Fenwick per sixty better at controlling play with their backups.
For the second time in three years, teams were better at controlling play with their backups in net.
2007-08

The average NHL team was 0.38 Fenwick events for per sixty better with their backups while the median was 0.83 per sixty better.

The average team gave up 0.38 Fenwick events per sixty less with their starter while the median was 0.53 less.
In total, the average NHL team in 2007-08 was 0.00001 Fenwick per 60 worse with their starters than backups while the median team was 0.36 better.
This is mostly a tie, showing that teams generate more offense with their backups, but control play equally as well no matter who is in net.
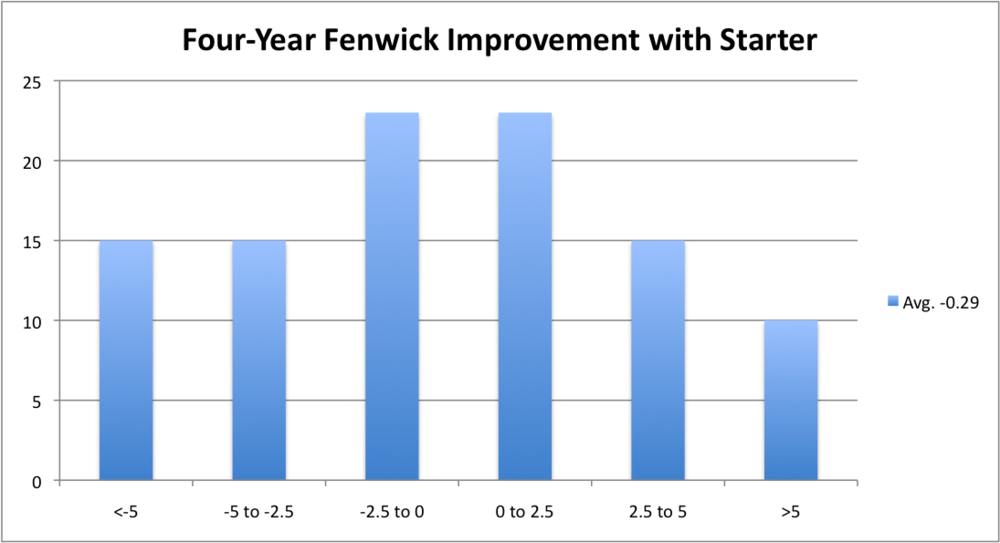
Four-Year Average
Put all four years together, and this is what you get.
Fenwick For – Teams received less offense with their starter by an average of 0.48 Fen/60, median 0.63 Fen/60.

Fenwick Against – Teams let fewer shots get through to their starter by an average of 0.19 Fen/60, Median 0.23 Fen/60.

Fenwick Ratio – Teams controlled play better with their backups by an average of 0.29 Fen/60, Median 0.05.
Conclusion
When looking at the broad picture, over the last four years, NHL teams were able to generate more shots with their backups in net. They were able to control play better with their backups in net. And while they gave up fewer shots against their starting goalie, it was by the smallest margin of the group.
All three of these conclusions are the opposite of what conventional wisdom says.
NHL teams may be more confident in front of better goalies, but it doesn’t generate into a better team. Simply put, the average NHL team is better at controlling play in front of their lesser goalies. The difference is rather small, but it shows that NHL teams do not receive an advantage when playing in front of their best goaltender.
Teams don’t open up and generate more scoring chances with a better goalie. They don’t tighten up and limit the number of shots their worse goalie sees. And they aren’t any better at controlling play with their best goalie.
It’s time to stop assuming a better goalie means the team will play better. Four years worth of data shows that NHL teams are just as good, if not better, at controlling the play and getting shots to the net when they have their backup goalies on the ice.


