


We recently looked at how balanced zone shifts compare a player against his peers in their ability to shift play from one end to the other, as judged by where shifts start and end.
Why not do the same thing with shots? After the jump, I’ll describe a new balanced Corsi metric that compares a player’s Corsi score to that of peers with similar usage.
As a reminder, the Corsi score is like +/-, but with shots instead of goals — you count how many shots are directed at the opposing net while the player was on the ice and subtract the shots directed at his own net. This metric has been shown to correlate well with goal scoring, puck possession, scoring chances, and duh, winning, so it’s a popular way to assess how teams and players are performing.
But something that Don Cherry doesn’t understand is that context matters too. It’s much harder for a player who’s starting in the defensive zone all the time and playing against tough competition to have a positive Corsi score. So in the spirit of the balanced zone shift analysis, let’s look at what happens if we group players by their offensive zone start percentage and look at whether they control shots better than their similarly-used peers.
As always, it starts with data collection. I used four years of data from behindthenet.ca, counting everyone who played in at least 3/4 of their team’s games. That gave me over 1800 player-seasons, which I sorted by offensive zone starts. Then it was easy to look at how any given player compared to players used similarly. Here’s a snippet of the data:

In 2008, Richards had a negative Corsi. But he had a ton of defensive starts, and when you compare him to the ten guys used most similarly, it’s clear that he was outperforming what you’d expect of someone put in those tough spots.
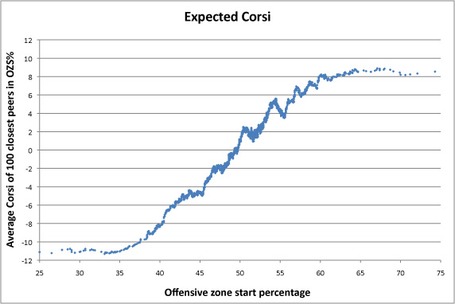
And that’s basically what I did for each player; I took the 100 closest comparisons in usage (50 above and 50 below) and averaged their results to see what I should expect from someone with that role. As you’d imagine, we expect better results from people put in easier spots:
From here, we can compare people’s performance to that of their peers. Just like the Richards example above, I went through every player and calculated their Balanced Corsi by seeing how they compared to what we’d expect of them; here are the leaderboards from the past few years:
| Player: 2010-2011 | Team | Balanced Corsi | Player: 2009-2010 | Team | Balanced Corsi | Player: 2008-2009 | Team | Balanced Corsi | Player: 2007-2008 | Team | Balanced Corsi | |||
| Ryan Kesler | VAN | 17.5 | Colin Fraser | CHI | 17.8 | Johan Franzen | DET | 23.5 | Henrik Zetterberg | DET | 24.7 | |||
| Sean Bergenheim | T.B | 16.9 | Patrice Bergeron | BOS | 17.7 | Pavel Datsyuk | DET | 21.0 | Pavel Datsyuk | DET | 22.8 | |||
| Pavel Datsyuk | DET | 15.8 | Marcel Goc | NSH | 17.4 | Marian Hossa | DET | 21.0 | Niklas Lidstrom | DET | 13.9 | |||
| Ryane Clowe | S.J | 15.7 | Ryan Kesler | VAN | 16.5 | David Moss | CGY | 20.6 | Patrik Elias | N.J | 12.6 | |||
| Christopher Higgins | VAN | 15.6 | Tomas Holmstrom | DET | 16.2 | Andrew Ladd | CHI | 20.3 | Alex Ovechkin | WSH | 12.6 | |||
| Joe Pavelski | S.J | 15.1 | Alex Ovechkin | WSH | 15.5 | Eric Fehr | WSH | 19.0 | Brian Rafalski | DET | 12.5 | |||
| Dominic Moore | T.B | 14.8 | John Madden | CHI | 15.2 | Henrik Zetterberg | DET | 18.9 | Boyd Gordon | WSH | 12.5 | |||
| Logan Couture | S.J | 14.6 | Niklas Lidstrom | DET | 14.6 | Niklas Lidstrom | DET | 16.5 | Ray Whitney | CAR | 12.4 | |||
| Nikolay Zherdev | PHI | 14.6 | Alexei Ponikarovsky | PIT | 14.5 | Brian Rafalski | DET | 16.3 | Kristian Huselius | CGY | 12.4 | |||
| Patrice Bergeron | BOS | 14.0 | Mason Raymond | VAN | 14.5 | Dave Bolland | CHI | 15.8 | David Steckel | WSH | 12.0 |
A few things stand out at me from this list:
- The list includes players in a lot of different roles, so we’ve achieved the goal of removing usage bias. (There is zero correlation between offensive zone starts and balanced Corsi.)
- The list includes a lot of players who we might expect, but there are a few interesting names thrown in to make you think a little. Nikolay Zherdev’s sphinx-like nature comes up again.
- The list does show substantial bias towards players on elite teams — when I tallied up people’s four-year totals, the leaderboard (not shown) had Red Wings at #1, 2, 3, 4, 5, 6, and 8. Like with +/-, you’re much more likely to be on the ice for a bunch of shots at the opposing net if the team around you tends to dominate play.
That last bullet point is something we can address. We can do the exact same analysis, but instead of using Corsi score, we can use relative Corsi. Relative Corsi is a measure of how much a player elevates his team — you compare how the team does with him on the ice to how they do with him off the ice, and give him credit for the difference. In theory, this should dramatically reduce the impact of his teammate’s skill.
Going through the same analysis of expected value as above, I calculated the Balanced Relative Corsi for each player, and again I’ll show the leaders from each year:
From this list, we see a small amount of bias in the other direction, towards players on lesser teams. If relative Corsi is a measure of how much a player elevates his team, it stands to reason that it would be harder to dramatically elevate an elite team. However, this effect is much milder than the huge bias on straight Corsi, and it averages out over multiple years; this time, when I totaled Balanced Corsi Rel over the four years, the leaders were much more reasonable: Visnovsky, DSedin, Getzlaf, Nielsen, Kesler, Williams, Kozlov, Bouchard, Penner, Ryan, Booth, Perry, Elias, HSedin, and Parise.
Finally, let’s take a look at what the balanced numbers say about the Flyers performance this year and over the last four years:
| Player | Balanced Corsi 2011 | Balanced Corsi Rel 2011 |
| Nikolay Zherdev | 14.6 | 16.2 |
| Claude Giroux | 8.1 | 13.9 |
| Jeff Carter | 6.8 | 8.4 |
| Andreas Nodl | 3.5 | 1.7 |
| Mike Richards | 2.4 | 2.0 |
| Darroll Powe | 0.6 | -1.8 |
| James van Riemsdyk | -1.7 | -0.5 |
| Daniel Briere | -2.9 | -1.8 |
| Scott Hartnell | -3.5 | -1.6 |
| Kris Versteeg | -4.1 | -1.0 |
| Jody Shelley | -6.7 | -10.1 |
| Blair Betts | -8.3 | -11.1 |
| Ville Leino | -8.7 | -3.5 |
| ———————— | ——————— | ——————— |
| Andrej Meszaros | 3.9 | 3.7 |
| Matt Carle | 3.2 | 5.6 |
| Kimmo Timonen | 2.1 | 3.8 |
| Chris Pronger | 1.0 | 0.9 |
| Braydon Coburn | -0.2 | 1.3 |
| Sean O’Donnell | -4.4 | -7.9 |
| Player | Balanced Corsi 2008-2011 | Balanced Corsi Rel 2008-2011 |
| Nikolay Zherdev | 9.5 | 10.6 |
| Mike Richards | 5.8 | 7.0 |
| Jeff Carter | 4.5 | 7.0 |
| Kris Versteeg | 4.1 | -2.0 |
| Claude Giroux | 4.0 | 7.7 |
| Andreas Nodl | 2.0 | 1.7 |
| Ville Leino | 1.5 | 0.0 |
| James van Riemsdyk | 0.6 | 1.6 |
| Scott Hartnell | -0.5 | 1.4 |
| Darroll Powe | -1.7 | -2.1 |
| Blair Betts | -2.9 | -10.9 |
| Daniel Briere | -5.8 | -1.8 |
| Jody Shelley | -6.5 | -10.5 |
| Dan Carcillo | -7.9 | -5.5 |
| ———————— | ——————— | ——————— |
| Braydon Coburn | 5.3 | 9.6 |
| Matt Carle | 3.2 | 6.2 |
| Chris Pronger | 1.4 | 0.3 |
| Andrej Meszaros | -0.6 | 0.3 |
| Kimmo Timonen | -0.9 | 1.8 |
| Sean O’Donnell | -2.7 | -6.9 |
| Nick Boynton | -2.9 | -1.6 |
Much like what we saw with the Balanced Zone Shifts recently, it seems the HBL line isn’t doing as well this year as other offensively-deployed lines at controlling the shots, but the second and third lines are doing better than most. This might be related to the relatively even balance of skill across the Flyers’ top three lines — their top line might not be as offensively stacked as some teams’, but their second and third lines are controlling play.
It’s also interesting that O’Donnell and Meszaros are at opposite ends of the spectrum this year even though they’ve been paired together all year (68% of the time O’Donnell has been on the ice, it’s been with Meszaros). I look forward to seeing what the WOWY scripts say — it may be that Meszaros has been a Corsi beast when he’s not saddled with O’Donnell as a partner.
And Zherdev isn’t just outperforming his peers this year; he’s been doing it his whole career. Over the last four years, he’s 17th league-wide among players with 200+ games in Balanced Corsi and 18th in Balanced Corsi Rel. What an enigma.
So to summarize, here’s what we’ve seen:
- Balanced Corsi and Balanced Corsi Rel are new ways to look at how a player controls play relative to his similarly-used peers.
- Both metrics are fine for comparing within a team, but when comparing across teams, Balanced Corsi Rel is much better because Balanced Corsi skews heavily towards players on elite teams. However, Balanced Corsi Rel does have a modest short-term bias towards players on lesser teams, so looking at both numbers is useful; a player who is on the leaderboard of both metrics (like Zherdev) is clearly outperforming his peers.
- When we look at the Flyers, we once again see that their forward depth has been driving their success, as it is their defensively-deployed second and third lines that are really outperforming other team’s comparably used players.
Attachment: spreadsheet with Balanced Corsi and Corsi Rel data.


