


Once again, I’ve pondered whether or not teams play better in front of their starter or backup goalie. This time, rather than look at the Flyers’ defensemen and their Corsi in front of Bobrovsky and Boucher, I’ve looked at league-wide Fenwick.
As a refresher, Fenwick counts goals, shots on goal, and missed shots. Unlike Corsi, it does not include blocked shots. All data is from Behind the Net, and includes all goalies who played last year. I calculated their Fenwick per 60 scores (all shot data was already in per 60 rates and there is no blocked shot data, so Fenwick per 60 it was). From there, I compared the starting goalie to the backup goalie(s).
Not included in the study were Anaheim, Colorado, Ottawa, and Tampa Bay due to them acquiring goaltenders midway through the season, which could not be accounted for. That left twenty-six teams.
Jump to see graphs and analysis of Fenwick For, Fenwick Against, and Fenwick improvements when team’s use their starters as opposed to their backups.
First, we’ll look at how teams’ Fenwick For improved when they put in their starter as opposed to their backup. Conventional wisdom is that a better goalie would open up a team to take more offensive chances, thus have a higher number of shots, and a better Fenwick For.
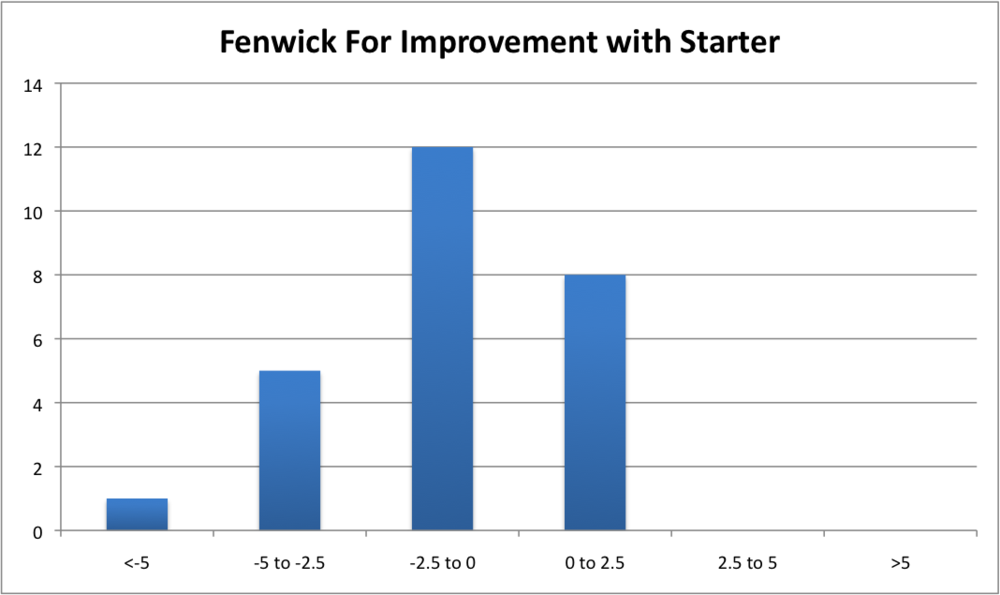
Unfortunately, the data does not match with conventional wisdom. Eighteen of the twenty-six teams (just under seventy percent) saw their Fenwick For drop when their starter was in net. Six teams received more than 2.5 shots less with their starter than with their backup, while no team saw as drastic an increase in their offense with their starter. In all, the average team got 1.1 fewer shots through to the net with their starter than with their backup.
In other words, when teams played their backups, they directed the puck on net more frequently than they did with their starting goalie. This isn’t a small difference either, as this held true for over two-thirds of the League and was over one shot per sixty minutes.
But what about shots given up? Conventional wisdom would say that teams play tighter defense in front of their backups, allowing fewer shots to get through for fear that they are less likely to be saved.
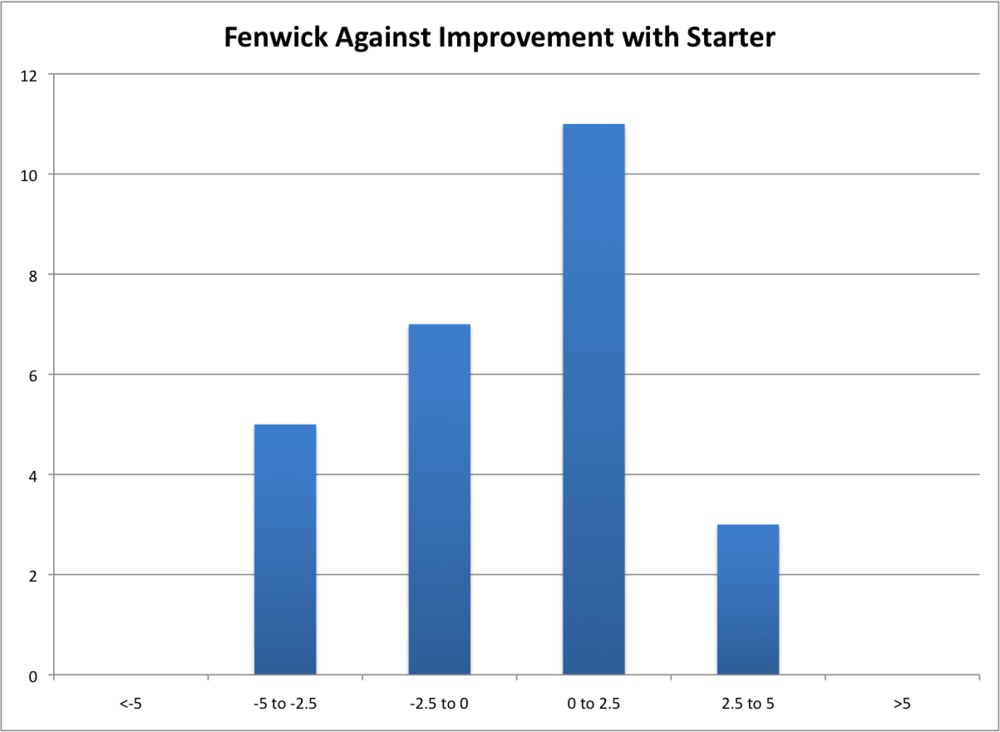
Again, conventional wisdom is wrong, though not by much. Fourteen teams allow fewer shots when their starter is in, twelve teams allow fewer shots when their backups are in. The average was 0.3 additional shots against per sixty minutes with the starter in net, though that is dragged down by Carolina (-4.9) and Toronto (-4.8).
Basically, teams allow the same amount of shots against when their backup is in net to when their starter is in net, meaning teams don’t tighten up defensive coverage in front of backups, nor do they give up more shots against their starter. Team defense doesn’t change.
Now, what about total Fenwick? Do teams control play better with their starter?
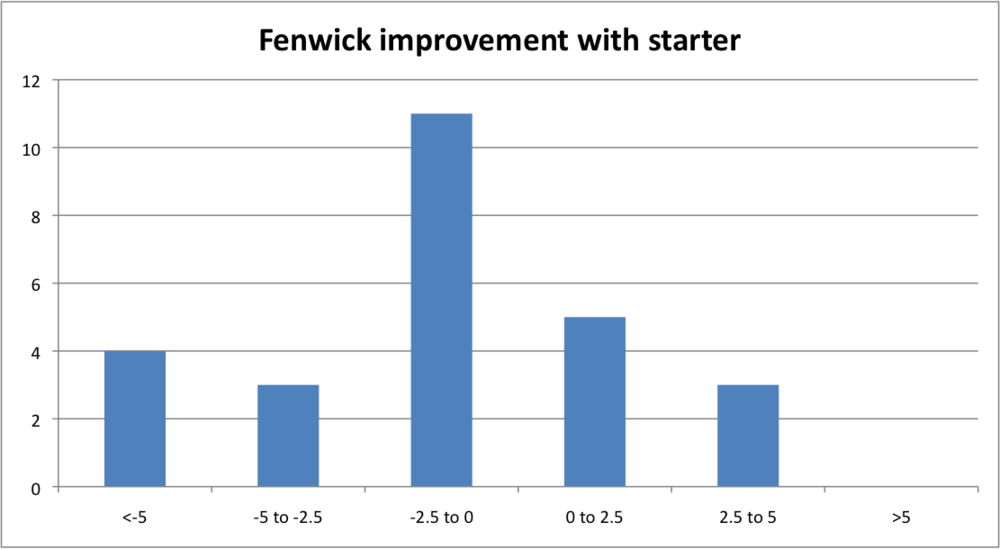
The range is a lot more spread out now, but once again, eighteen of twenty-six teams (just under seventy percent) control play better with their backups in net. The average team was 1.3 shots per sixty minutes better with their backup in net than their starter.
Conclusion
There is almost certainly some quality of competition effects going on here, and maybe even a small-sample size issue with Carolina. But if we look at three of the teams with the largest differences between their starter and backup – Atlanta, Carolina, and St. Louis – quality of competition doesn’t seem to make much of a difference.
In Carolina, nine of Justin Peters‘ twelve games played last year came against playoff teams. This is more of a small sample problem than quality of competition, since he faced a lot of good teams. In Atlanta, seventeen of Chris Mason‘s games – fifty-one percent – came against playoff teams, compared to Ondrej Pavelec‘s thirty-one games, or fifty-three percent. In St. Louis, fourteen of Ty Conklin‘s games came against playoff teams, giving him fifty-six percent. Compare to Jaroslav Halak‘s sixty-one percent, and there is again a difference of less than five percent.
Three of the largest spreads in the NHL, and quality of competition doesn’t appear to be all that different than the starter. Certainly, that would explain some of the difference, but it doesn’t explain why teams are in the offensive zone more often with their backups, nor why teams are better at controlling possession with their backups.
Those who still believe a better goalie means a more confident team, which in turn means a better team, are going to have to explain why that data points to the opposite conclusion.


