


Throughout the 2011-12 season, we’ve tracked every scoring chance for and against the Philadelphia Flyers. The data is tracked internally by teams around the NHL, including the Flyers, but is not published anywhere for public consumption. Thus, we’ve done the work throughout the year to bring these numbers to you, and now it’s time to look back on a season’s worth of data.
Why are scoring chances important? Well, HBO 24/7 taught us that Peter Laviolette thinks scoring chances are pretty important enough to use as the basis for an epic intermission rant. Our own Eric T. has also shown that scoring chances have a high correlation with Fenwick numbers, and it’s well established that Fenwick is a good predictor of future goal scoring. Check this or this for more on the importance of scoring chances.
A midseason review of Flyers scoring chances can be found here. Below, we’ll look at even strength results on a player-by-player basis.
Scoring chance definition
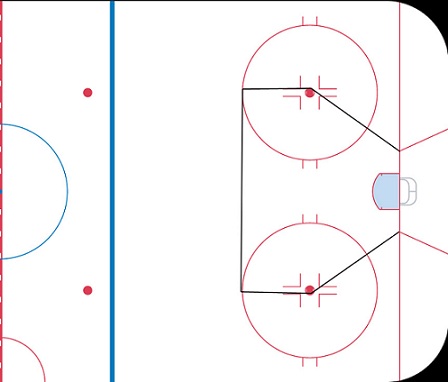
A scoring chance is defined as a clear play directed toward the opposing net from a dangerous scoring area — loosely defined as the top of the circle in and inside the faceoff dots (see below), though sometimes slightly more generous than that depending on the amount of immediately-preceding puck movement or screens in front of the net.
Blocked shots are generally not included but missed shots are. A player is awarded a scoring chance anytime he is on the ice and someone from either team has a chance to score. He is awarded a “chance for” if someone on his team has a chance to score and a “chance against” if the opposing team has a chance to score.
Scoring chance area
ES CF = season total even strength chances for;ES CA = season total even strength chances against; C% = scoring chance percentage; CF/15 = chances for per 15 minutes of even strength time on ice; CF/15 = chances against per 15 minutes of even strength time on ice; SCDIFF = total scoring chance differential; DIFF/15 = scoring chance differential per 15 minutes of even strength time on ice.
Forwards
| ES CF | ES CA | C% | CF/15 | CA/15 | SC Diff | Diff/15 | |
| E. WELLWOOD | 61 | 40 | 60.40% | 4.21 | 2.76 | 21.00 | 1.45 |
| J. JAGR | 281 | 219 | 56.20% | 4.41 | 3.44 | 62.00 | 0.97 |
| C. GIROUX | 348 | 272 | 56.13% | 4.41 | 3.44 | 76.00 | 0.96 |
| J. VORACEK | 281 | 230 | 54.99% | 4.36 | 3.57 | 51.00 | 0.79 |
| S. HARTNELL | 341 | 284 | 54.56% | 4.30 | 3.58 | 57.00 | 0.72 |
| J. VAN RIEMSDYK | 141 | 117 | 54.65% | 3.98 | 3.31 | 24.00 | 0.68 |
| Forward average | 199.64 | 184 | 51.23% | 3.60 | 3.36 | 15.64 | 0.24 |
| D. BRIERE | 260 | 250 | 50.98% | 3.94 | 3.79 | 10.00 | 0.15 |
| W. SIMMONDS | 241 | 237 | 50.42% | 3.48 | 3.42 | 4.00 | 0.06 |
| M. TALBOT | 221 | 219 | 50.23% | 3.34 | 3.31 | 2.00 | 0.03 |
| M. READ | 199 | 211 | 48.54% | 3.13 | 3.32 | -12.00 | -0.19 |
| B. SCHENN | 155 | 164 | 48.59% | 3.49 | 3.70 | -9.00 | -0.20 |
| S. COUTURIER | 148 | 173 | 46.11% | 2.59 | 3.03 | -25.00 | -0.44 |
| H. ZOLNIERCZYK | 46 | 59 | 43.81% | 2.55 | 3.27 | -13.00 | -0.72 |
| Z. RINALDO | 72 | 101 | 41.62% | 2.18 | 3.06 | -29.00 | -0.88 |
- Giroux, Jagr, Hartnell, Voracek, van Riemsdyk and Briere (and Wellwood but with a smaller sample size) were much better at generating chances for than the rest of the forwards. But while Giroux, Jagr, Hartnell, Voracek and JVR have a very high chance differential, Briere’s is much lower as there were a lot of chances against while he was on the ice.
- Giroux and Jagr are extremely hard to differentiate relative to the ice time they received. Of course, Giroux was on the ice a lot more at even-strength and therefore was on for a lot more chances, both for and against.
- The bottom eight forwards are a mixture of players put in difficult situations, like Talbot and Couturier, and players not known for their defense, like Briere and Rinaldo. Of the six rookie forwards to play over 200 minutes in the lineup this season, five of them are at the bottom.
- There is obviously a strong relationship between a players linemates and their chance results. Doing a WOWY (with or without you) analysis is one way that this problem will be addressed.
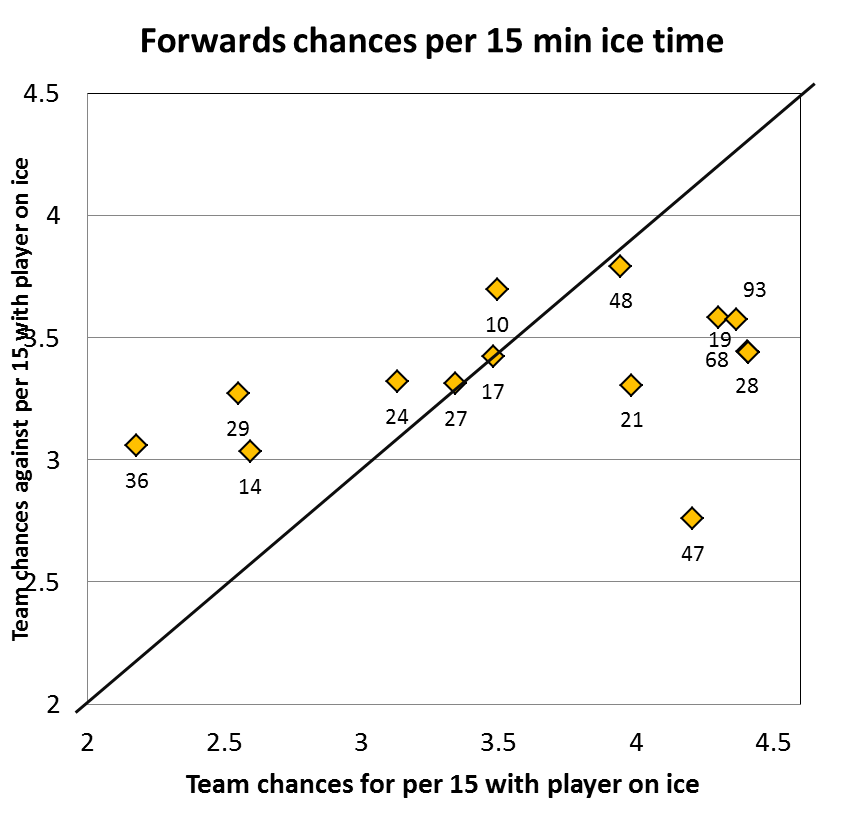
Note: The line represents a chance differential of zero, not the team average.
Chances attributed to the individual
| Chances | C/Game | |
| Giroux | 96 | 1.25 |
| Voracek | 90 | 1.15 |
| Jagr | 83 | 1.14 |
| Hartnell | 89 | 1.09 |
| JVR | 44 | 1.02 |
| Briere | 70 | 1.00 |
| Simmonds | 75 | 0.91 |
| Average | 57.79 | 0.86 |
| Read | 67 | 0.85 |
| Schenn | 43 | 0.80 |
| Wellwood | 19 | 0.79 |
| Talbot | 51 | 0.63 |
| Couturier | 44 | 0.57 |
| Zolnierczyk | 21 | 0.57 |
| Rinaldo | 17 | 0.26 |
- With JVR and Jagr gone, two of the better chance differential forwards are no longer on the team.
- Voracek looks more than capable at replacing Jagr on the top line, but the only other player on the right side of the differential is Jagr. Hopefully Schenn, Simmonds and Read can improve for next year to provide depth.
Defense
| ES CF | ES CA | C% | CF/15 | CA/15 | SC Diff | Diff/15 | |
| K. TIMONEN | 251 | 199 | 55.78% | 3.53 | 2.80 | 52 | 0.73 |
| M. CARLE | 399 | 335 | 54.36% | 3.91 | 3.29 | 64 | 0.63 |
| A. MESZAROS | 269 | 256 | 51.24% | 3.86 | 3.68 | 13 | 0.19 |
| M. BOURDON | 166 | 164 | 50.30% | 3.60 | 3.56 | 2 | 0.04 |
| Defense average | 199.22 | 188.33 | 50.29% | 3.48 | 3.44 | 11 | 0.04 |
| B. COBURN | 336 | 336 | 50.00% | 3.38 | 3.38 | 0 | 0.00 |
| E. GUSTAFSSON | 107 | 113 | 48.64% | 3.36 | 3.55 | -6 | -0.19 |
| P. KUBINA | 57 | 61 | 48.31% | 3.10 | 3.32 | -4 | -0.22 |
| A. LILJA | 135 | 144 | 48.39% | 3.45 | 3.68 | -9 | -0.23 |
| N. GROSSMANN | 73 | 87 | 45.63% | 3.09 | 3.68 | -14 |
-0.59 |
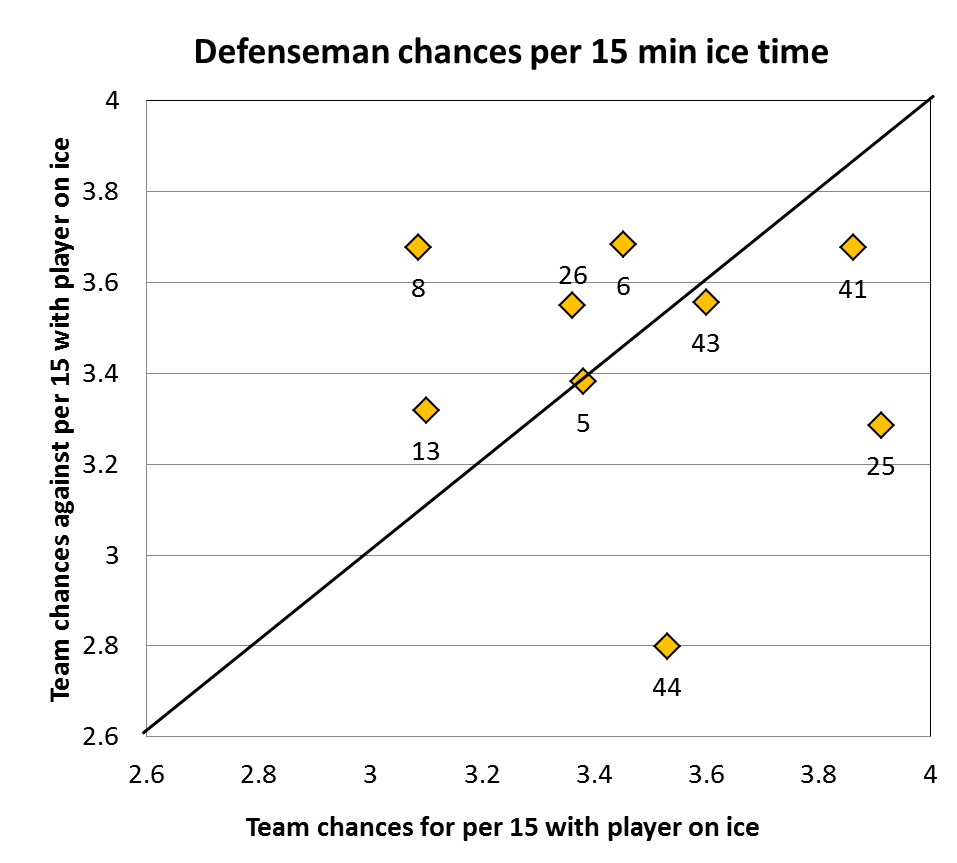
- Timonen and Carle were far and away the best performers.
- Bourdon appears to have done ok, but as he was paired most often with Carle it’s hard to determine his true contribution.
- Meszaros performed well offensively, but poorly defensively.
- In a small sample size against tough competition Grossmann didn’t perform well at all. (Fun fact: Grossman was a +1 SC Diff, Grossmann was -14 SC Diff).
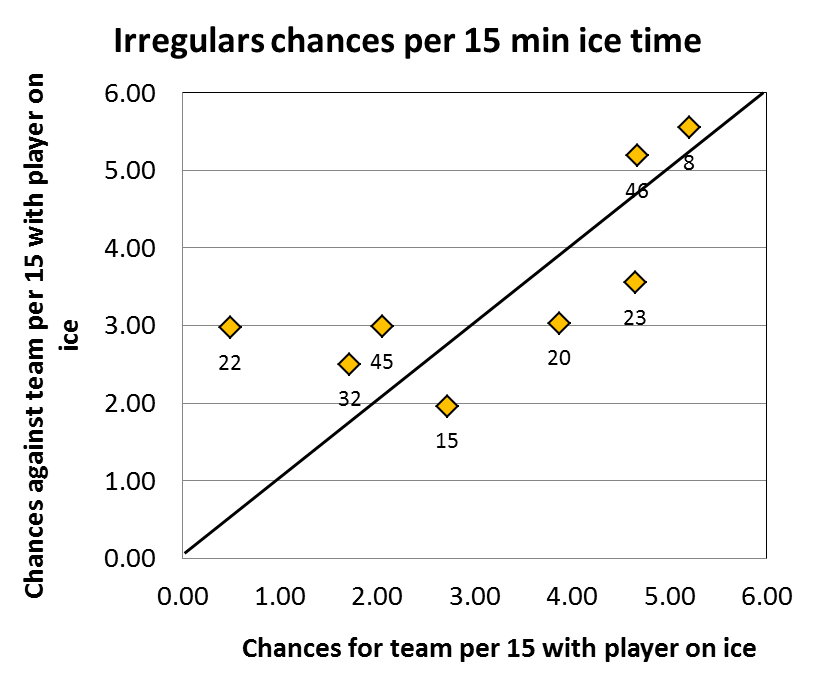
Irregulars (players with less than 200 minutes)
| ES CF | ES CA | C% | CF/15 | CA/15 | SC Diff | Diff/15 | |
| B. MANNING | 17 | 13 | 56.67% | 4.65 | 3.56 | 4 | 1.09 |
| C. PRONGER | 46 | 36 | 56.10% | 3.87 | 3.03 | 10 | 0.84 |
| A. NODL | 18 | 13 | 58.06% | 2.72 | 1.96 | 5 | 0.76 |
| M. WALKER | 15 | 16 | 48.39% | 5.20 | 5.55 | -1 | -0.35 |
| K.MARSHALL | 27 | 30 | 47.37% | 4.67 | 5.19 | -3 | -0.52 |
| T. SESTITO | 11 | 16 | 40.74% | 1.72 | 2.50 | -5 | -0.78 |
| J. SHELLEY | 22 | 32 | 40.74% | 2.05 | 2.98 | -10 | -0.93 |
| B.HOLMSTROM | 1 | 6 | 14.29% | 0.50 | 2.97 | -5 | -2.48 |
- This is more for completeness than anything else — a lot small sample sizes here.
Final thoughts
- There is an interesting trend noticeable from the forwards and defenseman graph; there is more variation in scoring chance generation (horizontal spread) than scoring chance prevention (vertical spread). This is perhaps not surprising that players have more control of the outcome when they have the puck than when they don’t, but it makes me wonder what Timonen does to be such an outlier.
- Carle, JVR and Jagr were all excellent in chance differential. I don’t believe their replacements will come anywhere near replicating their production./


